![]()
Get the report
Cost Estimate of Bill C-239: An Act to amend the Income Tax Act (Charitable Gifts).pdf
Summary
Bill C-239 proposes to replace the current monetary charitable contributions regime with a new framework for individuals. The new rate structure would enrich the existing federal incentives and provide that monetary gifts to registered charities made by individuals:
1. up to the first $400 would receive a 75 per cent tax credit;
2. for the subsequent $350 would receive a tax credit of 50 per cent; and,
3. all amounts above $750 would receive a tax credit of 33⅓ per cent.
Overall, if C-239 were implemented, it would cost the Government roughly $1.7 billion more in 2016, rising to $1.9 billion in 2020. This would bring the total annual cost of the credit to about $4.2 billion in 2016, an increase of about 68%.
Overall fiscal cost of Bill C-239
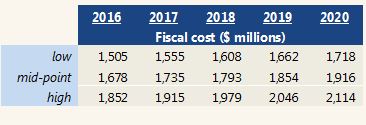
Source: Cost Estimate of Bill C-239: An Act to amend the Income Tax Act (Charitable Gifts)
Cost Estimate of Bill C-241: An Act to Amend the Excise Tax Act (School Authorities)
![]()
Get the report
Cost Estimate of Bill C-241: An Act to Amend the Excise Tax Act (School Authorities).pdf
Summary
This private member’s Bill amends the Excise Tax Act in order to increase the goods and services tax rebate rate for school authorities from 68% to 100%.
Source: Cost Estimate of Bill C-241: An Act to Amend the Excise Tax Act (School Authorities)
Casual Dress Code in Fashion at Work
One in Five Managers Say Employee Attire Is Less Formal Than Five Years Ago
Office attire gets complicated. (CNW Group/OfficeTeam)
TORONTO, June 1, 2016 /CNW/ – Dressing up for work continues to go out of style, new research from staffing firm OfficeTeam shows.
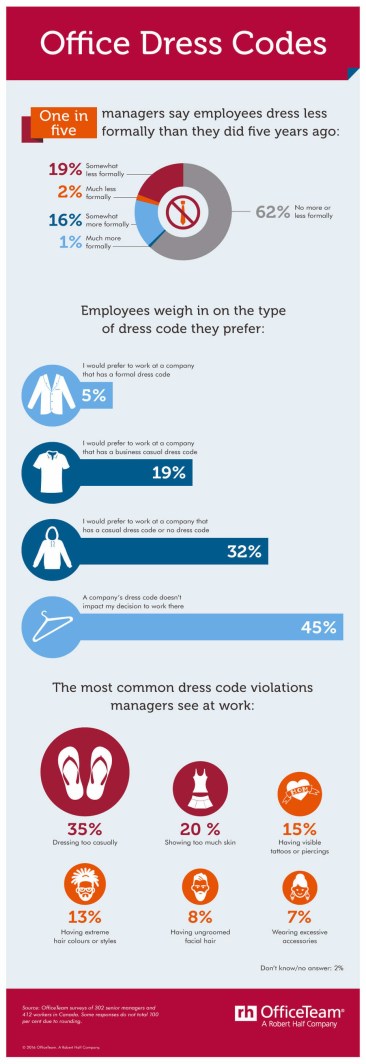
One in five (21 per cent) Canadian senior managers interviewed said employees wear less formal clothing than they did five years ago. In addition, 19 per cent of office workers stated they would prefer to be at a company with a business casual dress code; 32 per cent favour a casual dress code or no dress code at all.
But there are limits to what passes as acceptable office attire. When senior managers were asked about the most common dress code violation at work, wearing overly casual clothing was the top response (35 per cent), followed by showing too much skin (20 per cent).
Senior managers were asked, “Do you think employees at your company dress more or less formally than they did five years ago?”
Their responses:
|
Much more formally |
1% |
|
Somewhat more formally |
16% |
|
No more or less formally |
62% |
|
Somewhat less formally |
19% |
|
Much less formally |
2% |
|
100% |
Workers were asked, “Which of the following statements most closely describes how a company’s dress code impacts your decision to work there?”
Their responses:
|
I would prefer to work at a company that has a formal dress code |
5% |
|
I would prefer to work at a company that has a business casual dress code |
19% |
|
I would prefer to work at a company that has a casual dress code or no dress code |
32% |
|
A company’s dress code doesn’t impact my decision to work there |
45% |
|
101%* |
*Responses do not total 100 per cent due to rounding.
Senior managers were also asked, “Which of the following is the most common dress code violation at your company?”
Their responses:
|
Dressing too casually |
35% |
|
Showing too much skin |
20% |
|
Having visible tattoos or piercings |
15% |
|
Having extreme hair colours/styles |
13% |
|
Having ungroomed facial hair |
8% |
|
Wearing excessive accessories |
7% |
|
Other/don’t know/no answer |
2% |
|
100% |
“How employees present themselves, including how they dress in a business environment, reflects their level of professionalism and may effect perceptions of the company itself,” said Koula Vasilopoulos, a district president for OfficeTeam.
“Workers should be aware of business guidelines and take cues from their peers, particularly as they look to advance their careers, in order to ensure they leave an impression that is consistent with their desired roles.”
OfficeTeam offers seven questions employees should ask themselves when choosing what to wear for work:
- Does this follow company policy? If there’s a written dress code, abide by it. Also consider what your manager and coworkers wear, and use that information to guide your choices.
- Am I revealing too much? If you have to ask yourself this question, the answer is likely “yes.” Avoid clothes that show too much skin, and err on the side of caution when displaying tattoos or piercings.
- Is this distracting? Wearing wild or bright prints can attract attention for the wrong reasons. In most workplaces, neutral colours and simple patterns, such as pinstripes, are a safe bet.
- Am I overdoing it? Take a subtle approach to jewelry, makeup, perfume and cologne. Also note that unconventional hair colours or styles and unkempt facial hair may be frowned upon at more conservative companies.
- Do I feel confident? If you’re uncomfortable in your outfit, it’ll show. Make sure your clothes fit well and don’t require a lot of readjusting.
- Will I offend anyone? Steer clear of wearing apparel with profanity, political statements or other questionable material.
- Does it pass the final check? Give yourself a once-over from head to toe. Look out for wrinkled, torn or stained garments and scuffed shoes.
About the Research
The surveys of senior managers and workers were developed by OfficeTeam. They were conducted by independent research firms and include responses from more than 300 senior managers at Canadian companies with 20 or more employees, and more than 400 Canadian workers 18 years or older and employed in office environments.
High school coaches are throwing their pitchers under the bus – Chicago Tribune
Paul Bergstrom pitches Friday for Notre Dame College Prep against Loyola Academy. He left the game after about 50 pitches. (Abel Uribe / Chicago Tribune)
May 30,2016
High school baseball pitchers rack up some pretty impressive stats these days: Fastballs in the upper 80s and a 9.12 percent annual increase in UCLRs.
Translating for nongeeks: Hard-throwing high schoolers are wearing out their arms and driving up the need for Tommy John surgery, a serious elbow procedure technically known as ulnar collateral ligament reconstruction.
What a bizarre and completely unnecessary phenomenon. Where are the coaches? Watching from the dugout as kids hurt themselves by pitching too many innings in too many games.
In the major leagues, where pitching time is carefully monitored to prevent injuries, a typical starter throws about 105 pitches per game. Still, hurlers get hurt because pitching is tough on the body. Then there’s Brady Huffman of Genoa-Kingston High in DeKalb County, who tossed 167 pitches in a game this season, the Tribune’s John Keilman reports. “I trust him when he says that he has something left,” Huffman’s clueless coach told the Daily Chronicle of DeKalb.
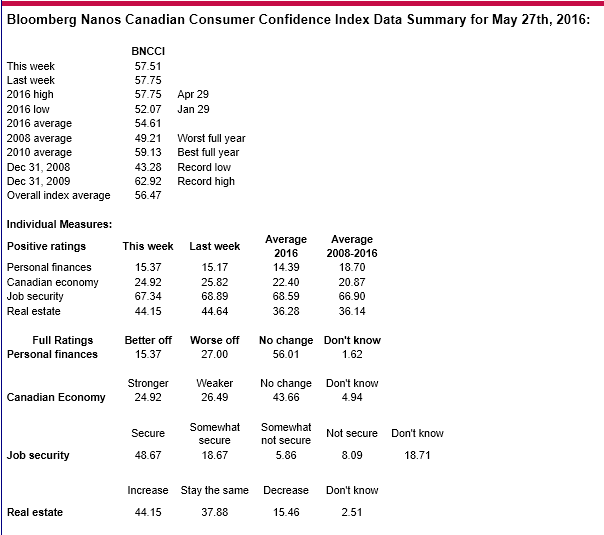
Positive trajectory for consumer confidence flattens – still near high for 2016 (released May 30, 2016)

Bloomberg Nanos Weekly Consumer Confidence Tracking
After a positive series of weeks in the Bloomberg Nanos Canadian Confidence Index – the index remained steady in the week over week numbers.
“Even with the one week abatement, overall confidence remained near a high for 2016,” said Nanos Research Group Chairman Nik Nanos.
“Long-term demographic trends, labour market displacements, and a deficit of business investment continue to weigh on the economy’s potential output, according to recent analysis. Add to that the direct and indirect effects of the economic shocks on household balance sheets. Still, the trend in consumer expectations continues to be positive, which suggests an extended honeymoon period for the new government and the prospect of a fiscal stimulus”, said Bloomberg economist Robert Lawrie.
The BNCCI, a composite of a weekly measure of financial health and economic expectations, registered at 57.51 compared with last week’s 57.75. The twelve month high stands at 58.62.
The Bloomberg Nanos Pocketbook Index is based on survey responses to questions on personal finances and job security. This sub-indice was at 58.23 this week compared to 58.64 the previous week. The Bloomberg Nanos Expectations Index, based on surveys for the outlook for the economy and real estate prices, was at 56.78 this week (compared to 56.85 last week).
The average for the BNCCI since 2008 has been 56.47 with a low of 43.28 in December 2008 and a high of 62.92 in December 2009. The index has averaged 54.61 this year.
To view the weekly tracking visit our website.
Methodology
The BNCCI is produced by the Nanos Research Corporation, headquartered in Canada, which operates in Canada and the United States. The data is based on random telephone interviews with 1,000 Canadian consumers (land- and cell-lines), using a four week rolling average of 250 respondents each week, 18 years of age and over. The random sample of 1,000 respondents may be weighted by age and gender using the latest census information for Canada and the sample is geographically stratified to be representative of Canada. The interviews are compiled into a four week rolling average of 1,000 interviews where each week, the oldest group of 250 interviews is dropped and a new group of 250 interviews is added. The views of 1,000 respondents are compiled into a diffusion index from 0 to 100. A score of 50 on the diffusion index indicates that positive and negative views are a wash while scores above 50 suggest net positive views, while those below 50 suggest net negative views in terms of the economic mood of Canadians.
A random telephone survey of 1,000 consumers in Canada is accurate 3.1 percentage points, plus or minus, 19 times out of 20.
All references or use of this data must cite Bloomberg Nanos as the source.
Bloomberg Nanos Canadian Consumer Confidence Index Data Summary for May 27th, 2016: