Fiscal and Economic Impacts of Curtailing the Planned Tax Cut for Small Businesses

Get the report
Fiscal and Economic Impacts of Curtailing the Planned Tax Cut for Small Businesses.PDF

Summary
PBO estimates that the Budget 2016 decision to defer reductions in the small business tax rate will reduce federal revenues by $45 million in 2016-17, and increase revenues by $155 million in 2017-18 rising to $815 million in 2020 21 (Summary Table 1).  The initial reduction in revenues reflects timing differences in the tax reference years related to the filing deadlines for personal and corporate income tax returns.

Summary Table 1 – Fiscal impact of changes to the small business tax rate

PBO estimates that by 2020-21, Budget 2016 changes to the small business tax rate will reduce real GDP by $300 million (0.015 per cent) and the level of employment by about 1,240 jobs created or maintained (Summary Table 2).

Summary Table 2 – Economic impact of changes to the small business tax rate

Source: Fiscal and Economic Impacts of Curtailing the Planned Tax Cut for Small Businesses

Canadian Government Economic and Fiscal Outlook – April 2016

Get the report
Economic and Fiscal Outlook – April 2016

Get the data

EFO April 2016 – Figures.xlsx  

Summary

This report responds to the 4 February 2016 Standing Committee on Finance motion. It incorporates data available up to and including 12 April 2016.

Since the Parliamentary Budget Officer’s November 2015 report, the outlook for the global economy has deteriorated further. Expectations of the future path of prices for key commodities have also been revised lower.

Despite this weaker external outlook, PBO anticipates that the combination of fiscal measures in Budget 2016 and accommodative monetary policy will help bolster the Canadian economy.

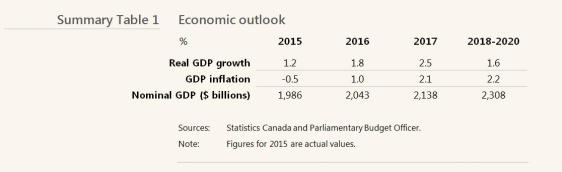
PBO projects that growth in real gross domestic product (GDP) will rebound to 1.8 per cent in 2016 and then rise to 2.5 per cent in 2017. Economic growth is then expected to moderate over 2018 to 2020, reflecting the tapering of fiscal measures and the normalization of monetary policy.

The level of nominal GDP—the broadest single measure of the tax base—is projected to be almost $20 billion lower each year, on average, between 2016 and 2020 compared to our November report.

However, relative to the Government’s planning assumption for nominal GDP in Budget 2016 our projection is, on average, $40 billion higher per year over 2016 to 2020. The difference is most pronounced in 2016 and 2017, reaching close to $50 billion in those years.

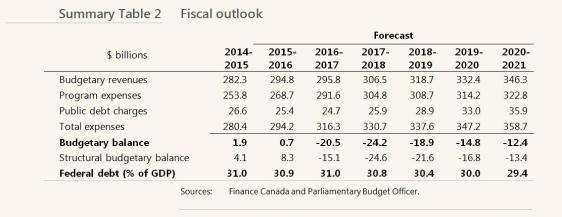
PBO’s November 2015 fiscal outlook provided an independent status quo planning assumption for the start of the 42nd Parliament. We have updated our fiscal outlook to include measures announced in Budget 2016 as well as measures announced prior to the budget.

PBO estimates there was a small surplus in 2015-16. We expect a budgetary deficit of $20.5 billion in 2016-17, which is mostly attributable to $13.2 billion of new measures since the Fall Update. The deficit is then projected to rise to $24.2 billion in 2017-18 as the result of moving to the 7-year breakeven mechanism for Employment Insurance premium rates (a 15 per cent reduction in contributions) and a $7.5 billion increase in direct program expenses.

We project the deficit to decline to $12.4 billion over 2018-19 to 2020-21 based on the Government’s forecast that direct program expenses (DPE)—in particular the operating costs of departments—will remain flat over the period 2017-18 to 2019-20.

PBO’s forecast of the budgetary deficit is $4.5 billion lower, on average, than Budget 2016 over the projection horizon. The average difference is roughly in line with the Budget 2016 forecast adjustment, which removed $40 billion from GDP (equivalent to $6 billion in revenues) in each year of the Government’s planning horizon.

Source: Economic and Fiscal Outlook – April 2016

Canadian Government Expenditures For The First Half of 2015-16

logo1

Get the report
Expenditure Monitor 2015-2016 Q2

Get the data
Expenditure Monitor 2015-16 Q2.xlsx

Summary
Total government expenditures for the first half of 2015-16 were $124.7 billion, an increase of 5.5 per cent over the same period last year ($118.2 billion). This is slightly higher than the 3.4 per cent increase in total program expenses outlined in Budget 2015. Most of this increase draws from the Government’s new enhanced Universal Child Care Benefit (UCCB). The first cheques for this enhanced benefit were delivered in July, adding $3.2 billion to the previous year’s UCCB payments.

Infrastructure spending is responsible for most of the remaining increase. Supplementary Estimates (A) 2015-16 requested over $1.1 billion for infrastructure renewal. The programs that were major recipients of these infrastructure funds have increased spending by $284 million compared to the previous year, an overall increase of 5.6 per cent. When combined with $151 million in increased spending by the Office of Infrastructure Canada’s Large Scale Infrastructure Investments program, this brings the investment in infrastructure renewal to $435 million by the end of the summer of 2015.

These spending increases are offset by lower interest rate costs on public debt. With the decline in the long-term bond yields, the Government’s average interest rate on public debt has fallen from 2.83 per cent in 2011 to 2.23 per cent in 2014. Further decreases have provided $327 million in savings from public debt interest in the first six months of 2015-16. These savings look set to continue until interest rates begin to rise.

Related reports

Supplementary Estimates (A) 2015-16

The Government Expenditure Plan and Main Estimates for 2015-16