Federal Spending on Postsecondary Education

5 May 2016

Get the report
Federal Spending on Postsecondary Education.pdf

Get the data
Postsecondary Education –  Data.xls
Interactive Chart

Summary

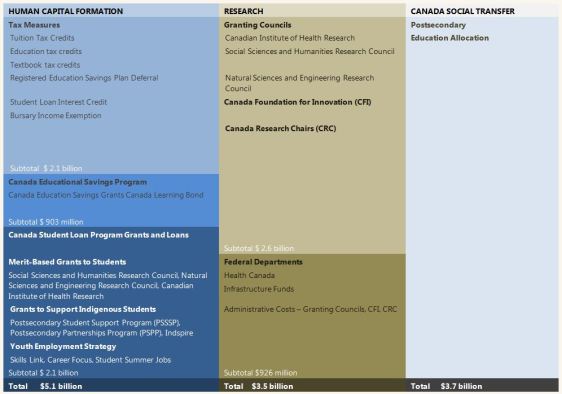
Table 1:  Federal Postsecondary Education Expenditure by Major Stream, 2013-14

This report analyzes federal spending on postsecondary education in Canada over the past 10 years; and, where possible, analyzes the distributional impacts of federal programs.  It also provides forward projections to 2020-21 taking into account recent Budget 2016 announcements.

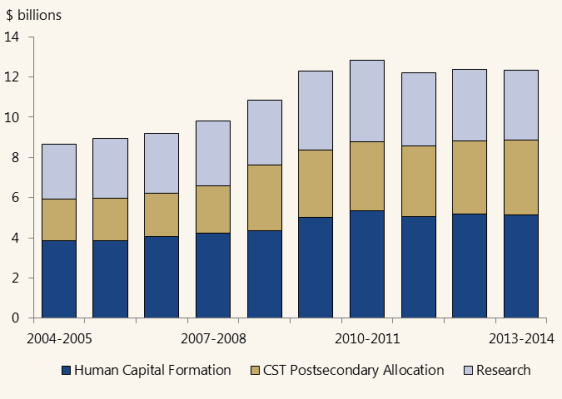
In 2013-14, total federal spending on postsecondary education reached an estimated $12.3 billion. This represents a decline from its peak of $12.8 billion in 2010-11. Over the past ten years, the greatest growth occurred in spending that supports human capital formation and the Canada Social Transfer (CST).

PBO estimates that roughly 60 per cent of postsecondary students belonged to higher-income families (that is, the two highest after-tax or disposable income quintiles).

Increases in federal funding targeted towards human capital formation have primarily benefited these families. This was due to a growing share of federal support provided through the tax system and the Canada Education Savings Program, Registered Educational Savings Plans.

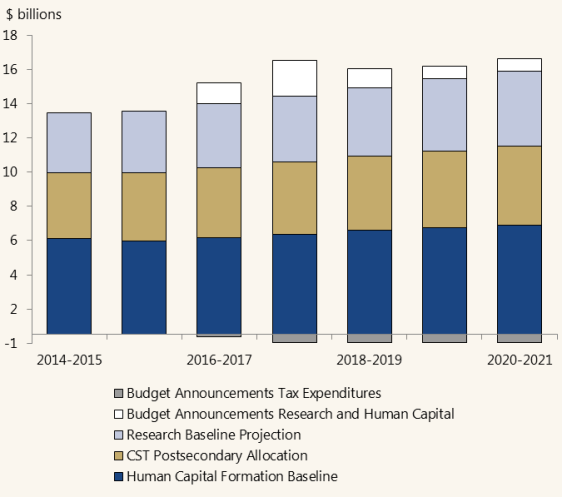
Figure 1: Federal Expenditures on Postsecondary Education, by Area of Focus

Taking into account recent Budget 2016 announcements, PBO estimates total federal spending on postsecondary education will exceed $15.7 billion by 2020-21. The re-allocation of education and textbook tax expenditure savings towards increases in student grants, loan repayment and student employment assistance (announced in Budget 2016) will likely make postsecondary education more affordable for some Canadians. These measures will not, however, significantly change the distribution of total federal spending on postsecondary education.

Figure 2: Expenditure Projections – Total Federal Expenditures on Postsecondary Education

Source: Federal Spending on Postsecondary Education

2015-16 Supplementary Estimates (C)

Get the report

2015-16 Supplementary Estimates (C).pdf

Get the data

2015-16 Supplementary Estimate (C) Data.xls

Summary

The third Supplementary Estimates for the 2015-16 fiscal year outline $5.1 billion of additional budgetary spending. This brings total planned budgetary spending for the year to $251 billion, 3.7 per cent higher than the previous year.

The request consists of an additional $2.8 billion of voted appropriations from Parliament and outlines an additional $2.3 billion in statutory spending.

Voted appropriations include a $435 million top up of the long-term disability insurance for members of the Canadian Armed Forces. The Government also wrote off $176 million in defaulted student loans and provided a $168 million grant to the Green Climate Fund.

Statutory spending increases stem from a $4.8 billion increase in Universal Child Care Benefit payments, which are partially offset by $2.6 billion of savings from lower interest payments on public debt.

Lastly, for the first time, these Supplementary Estimates (C) publish details regarding $5.1 billion of unspent funds, of which $1.8 billion are Treasury Board Central Votes, and $3.3 billion are frozen allotments. Frozen allotments are moneys approved by Parliament but held in escrow by the Treasury Board. Since 2004-05, frozen allotments have, on average, represented roughly two-fifths of annual “lapsed” funding. If the pattern from previous years holds, this would imply a total lapse higher than the Government projected in Budget 2015.  This would potentially result in lower than anticipated Direct Program Expenses.

Source: 2015-16 Supplementary Estimates (C)

Canadian Government Expenditures For The First Half of 2015-16

logo1

Get the report
Expenditure Monitor 2015-2016 Q2

Get the data
Expenditure Monitor 2015-16 Q2.xlsx

Summary
Total government expenditures for the first half of 2015-16 were $124.7 billion, an increase of 5.5 per cent over the same period last year ($118.2 billion). This is slightly higher than the 3.4 per cent increase in total program expenses outlined in Budget 2015. Most of this increase draws from the Government’s new enhanced Universal Child Care Benefit (UCCB). The first cheques for this enhanced benefit were delivered in July, adding $3.2 billion to the previous year’s UCCB payments.

Infrastructure spending is responsible for most of the remaining increase. Supplementary Estimates (A) 2015-16 requested over $1.1 billion for infrastructure renewal. The programs that were major recipients of these infrastructure funds have increased spending by $284 million compared to the previous year, an overall increase of 5.6 per cent. When combined with $151 million in increased spending by the Office of Infrastructure Canada’s Large Scale Infrastructure Investments program, this brings the investment in infrastructure renewal to $435 million by the end of the summer of 2015.

These spending increases are offset by lower interest rate costs on public debt. With the decline in the long-term bond yields, the Government’s average interest rate on public debt has fallen from 2.83 per cent in 2011 to 2.23 per cent in 2014. Further decreases have provided $327 million in savings from public debt interest in the first six months of 2015-16. These savings look set to continue until interest rates begin to rise.

Related reports

Supplementary Estimates (A) 2015-16

The Government Expenditure Plan and Main Estimates for 2015-16

The Fiscal and Distributional Impact of Changes to the Federal Personal Income Tax Regime

Get the report
The Fiscal and Distributional Impact of Changes to Personal Income Tax

Get the data
PIT_Estimates

Summary
The member for Rimouski-Neigette-Temiscouata-Les Basques, Mr. Guy Caron, requested that the Parliamentary Budget Officer analyze the fiscal and distributional impact of two changes to the federal personal income tax (PIT) regime announced by the government in December 2015:

1.       Introducing a 33.0 per cent PIT rate on taxable income over $200,000, effective January 1, 2016.

2.       Reducing the PIT rate on the second tax bracket (taxable income of $45,283 to $90,563 in 2016) from 22.0 per cent to 20.5 per cent, effective January 1, 2016.

The member also requested that the change to the second bracket be compared to an alternative:

  1. Reducing the PIT rate on the first income tax bracket from 15.0 per cent to 14.0 per cent (up to $45,282 of taxable income in 2016), starting on January 1, 2016.

PBO estimates the net primary impact as the increase (or decrease) in federal revenues and expenses resulting from tax rate changes applied to the existing tax base. PBO further estimates a behavioural response of taxfilers to the new lower (or higher) marginal tax rates based on assumptions for the elasticity of taxable income. The net primary impact in combination with the behavioural response is equal to the expected net fiscal impact on the government’s budget balance.

PBO estimates that the net fiscal impact of the first two changes will reduce PIT revenues by $0.4 billion in 2015-16 and about $1.7 billion annually on average from 2016-17 to 2020-21. That is, the estimated revenue gains from introducing a new tax rate of 33.0 per cent on taxable income over $200,000 fall short of covering the estimated loss in revenues from reducing the PIT rate on the second tax bracket by $8.9 billion from 2015-16 to 2020-21. Reducing the first personal income tax rate from 15.0 to 14.0 per cent would reduce revenue by $0.9 billion in 2015-16 and about $4.1 billion on average annually from 2016-17 to 2020-21.

Introducing the new tax bracket for taxable income over $200,000 at a rate of 33.0 per cent will affect taxpayers in the top decile.  The top 1.4 per cent of taxpayers will pay an additional $5,255 on average. The second bracket change will affect 43 per cent of taxpayers, and primarily the top 30 per cent of earners.  The first bracket change will affect the most number of taxpayers with tax savings distributed across the top 60 per cent of earners.

Source: The Fiscal and Distributional Impact of Changes to the Federal Personal Income Tax Regime

An Assessment of Canadian Government’s Fiscal Outlook

1 December 2015

Get the report
An Assessment of the Government’s Fiscal Outlook.PDF

Summary
Forecast comparison

On balance, the outlooks for the budgetary balance between 2015-16 and 2018-19 are similar. Finance Canada projects budget deficits averaging $2.7 billion a year while PBO projects budget deficits averaging $2.9 billion.

However, for the fiscal years 2019-20 and 2020-21, the Government projects budget surpluses of $1.7 billion and $6.6 billion respectively, while PBO projects deficits of $4.6 billion and $4.2 billion. Relative to gross domestic product (GDP), the difference in outlooks amounts to 0.3 percentage points in 2019-20 and 0.4 percentage points in 2020-21.

Comparison of outlooks for the budgetary balance ($ billions)
2015-16 2016-17 2017-18 2018-19 2019-20 2020-21
PBO 1.2 -3.0 -4.7 -5.0 -4.6 -4.2
Finance Canada -3.0 -3.9 -2.4 -1.4 1.7 6.6
Difference -4.2 -0.9 2.3 3.6 6.3 10.8
Sources:  Finance Canada and Parliamentary Budget Officer.

The difference in budgetary balance projections over 2017-18 to 2020-21 stems from the Government’s more optimistic outlook for revenues from personal and corporate income taxes (PIT and CIT), as well as the Goods and Services Tax (GST).

Forecast revisions

Finance Canada’s downward revision to its planning assumption for nominal gross domestic product (GDP) from Budget 2015 averages $40 billion a year (-1.8 per cent) over 2016 to 2019. Even so, relative to Budget 2015 the department shows only a modest downward revision to its outlook for revenues from PIT, CIT and GST, averaging $1.1 billion (-0.4 per cent) a year over 2016-17 to 2019-20. This reflects Finance Canada’s assumption that higher-than-expected revenues observed in 2014-15 and 2015-16 (year to date) carry forward over the entire forecast horizon.

In contrast, PBO does not assume that higher-than-expected revenues carry forward over the entire forecast.

Finance Canada’s forecast adjustment

To account for the possibility of lower oil prices or weaker-than-expected global growth in its Update, the Government adjusted downward the private sector forecast of nominal GDP from Finance Canada’s October 2015 survey.

In PBO’s view, the Government’s forecast adjustment would only balance the downside risk to the private sector outlook for oil prices. PBO believes that downside risk remains to the Government’s planning assumption for nominal GDP. This reflects a relatively optimistic private sector forecast of real GDP growth over 2018 to 2020.

A note of clarification:  PBO’s fiscal outlook provided to the House of Commons Standing Committee on Finance in April 2015 was based on the fiscal measures and fiscal structure from Budget 2015. Our April outlook indicated—based on our economic outlook at the time—that this structure would generate relatively small deficits over the medium term.

In November we downgraded our fiscal projection on the basis of a weaker projected economic outlook. We now believe that the current fiscal structure will lead to a deficit in 2016-17 and larger deficits over the rest of the forecast period relative to PBO’s April forecast.

Source: An Assessment of the Government’s Fiscal Outlook