Budget 2016: Key Issues for Parliamentarians

Get the report
Budget 2016: Key Issues for Parliamentarians.pdf

Summary
The presentation of the fiscal plan

The Government has made changes to the presentation of its fiscal plan that have made it more difficult for parliamentarians to scrutinize public finances.

  • The Government did not provide detailed tables that identify the impact of changes to its adjustment to the private sector forecast and the effect of policy measures.
  • Budget 2016 shortened the time horizon of cost estimates from 5 years to 2 years.
  • Key fiscal information is being released outside of the budget and Fall Update with no reconciliation between the main documents.

To maintain consistency with past presentation practices, PBO has attempted to compile the standard fiscal planning tables for Budget 2016. However, PBO is unable to provide completed tables due to the lack of information provided in Budget 2016. PBO requested the necessary data from Finance Canada in order to publish completed tables for parliamentarians.

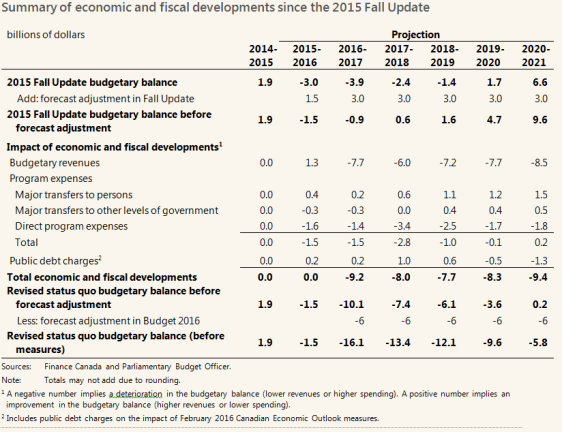
The Government’s adjustment to private sector economic assumptions

Budget 2016 highlights that the use of private sector economic forecasts for fiscal planning “introduces an element of independence in the Government’s fiscal forecast.” However, in Budget 2016, the Government judged it appropriate to lower the private sector forecast of nominal gross domestic product (GDP)—the broadest single measure of the tax base—by $40 billion per year over 2016 to 2020. This forecast adjustment translates into a fiscal impact of $6 billion annually over 2016-17 to 2020-21.

Based on historical experience, PBO believes that the $40 billion per year forecast adjustment to the February 2016 private sector forecast of nominal GDP in 2016 and 2017 is excessive. Indeed, based on the past performance of private sector forecasters, it is likely that the actual outcome for nominal GDP in 2016 and 2017 will exceed the levels used for fiscal planning purposes, resulting in smaller-than-expected budgetary deficits in 2016-17 and 2017‑18, all else being equal.

PBO believes that the Government’s adjustments to the private sector forecast (particularly when the adjustments are excessive and always in the same direction) erode the “element of independence” that is introduced into the fiscal plan by using the average private sector forecast.

PBO is, however, encouraged by the inclusion of alternative growth scenarios in Budget 2016 to gauge the sensitivity of the fiscal track. Budget 2016 also commits the Government to develop alternative growth scenarios and their fiscal implications, communicating the analysis “to Canadians as projections are updated.”

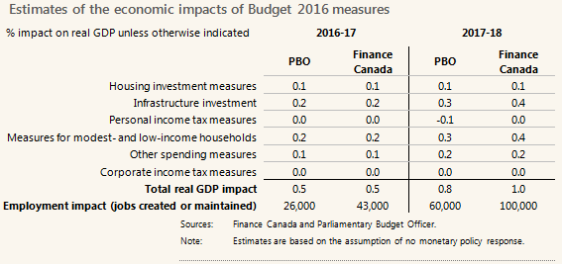
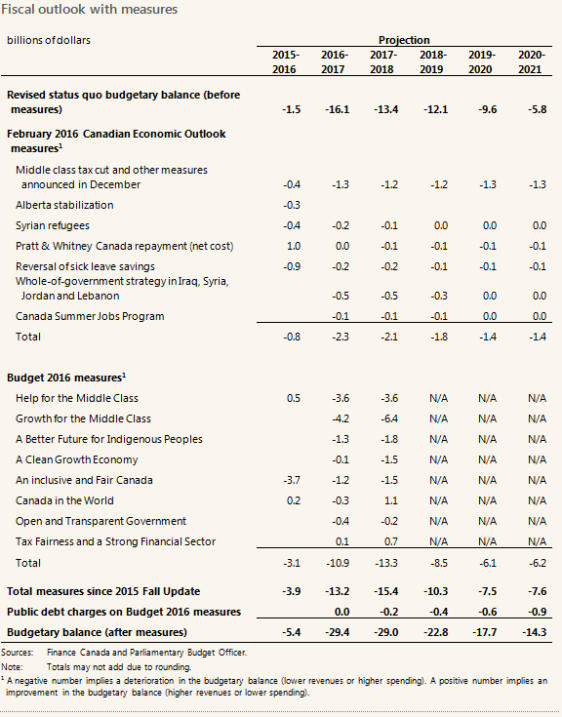
Finance Canada’s estimates of the economic impacts of Budget 2016 measures

Finance Canada has provided estimates of the economic impacts of measures contained in Budget 2016 based on its macroeconomic and fiscal model. However, unlike previous analyses, Finance Canada did not conduct an external assessment of its estimates. For instance, in Budget 2009, to gauge the sensitivitiy of its estimates, Finance Canada asked private sector organizations to calculate comparable fiscal multipliers.

To provide parliamentarians with an independent estimate of the economic impacts of Budget 2016 measures, PBO has used its own macroeconomic and fiscal model. On balance, these estimates are somewhat smaller than Finance Canada’s.

PBO’s estimates assume that measures in Budget 2016 will be implemented as scheduled and as targeted. Aside from the uncertainty surrounding fiscal multiplier estimates, differences in timing (for example by lapsing funds) or in the targeted sector would impact these results.

Source: Budget 2016: Key Issues for Parliamentarians

The Canadian Government’s Expenditure Plan for 2016-17

Get the report
The Government’s Expenditure Plan for 2016-17

Get the data

Main Estimates Figures. xlsx

Summary
The Government’s Expenditure Plan and Main Estimates for 2016-17 outline $250.1 billion in budgetary spending authorities. This represents a decrease of approximately $550 million compared to total budgetary authorities outlined in 2015-16, mostly driven by decreases in direct program spending (DPS), partially offset by increases in major transfers to persons, and other levels of government.

The decline, in general, stems from the sun-setting of various initiatives, for example the remediation of contaminated sites. Some of these measures are likely to be re-announced sometime in the future. Associated with this are expectations of future requests for funds through the Supplementary Estimates process, later in the year.

The Government has also initiated a pilot project, providing parliamentarians the ability to approve Transport Canada’s grants and contributions at the program level. This move allows Parliament to provide greater scrutiny on the spending of funds, and builds on recent transparency initiatives, notably the TBS InfoBase and the publication of frozen allotments in Supplementary Estimates (C) 2015-16.

Spending by policy area

Source: The Government’s Expenditure Plan for 2016-17

The Fiscal and Distributional Impact of Changes to the Federal Personal Income Tax Regime

Get the report
The Fiscal and Distributional Impact of Changes to Personal Income Tax

Get the data
PIT_Estimates

Summary
The member for Rimouski-Neigette-Temiscouata-Les Basques, Mr. Guy Caron, requested that the Parliamentary Budget Officer analyze the fiscal and distributional impact of two changes to the federal personal income tax (PIT) regime announced by the government in December 2015:

1.       Introducing a 33.0 per cent PIT rate on taxable income over $200,000, effective January 1, 2016.

2.       Reducing the PIT rate on the second tax bracket (taxable income of $45,283 to $90,563 in 2016) from 22.0 per cent to 20.5 per cent, effective January 1, 2016.

The member also requested that the change to the second bracket be compared to an alternative:

  1. Reducing the PIT rate on the first income tax bracket from 15.0 per cent to 14.0 per cent (up to $45,282 of taxable income in 2016), starting on January 1, 2016.

PBO estimates the net primary impact as the increase (or decrease) in federal revenues and expenses resulting from tax rate changes applied to the existing tax base. PBO further estimates a behavioural response of taxfilers to the new lower (or higher) marginal tax rates based on assumptions for the elasticity of taxable income. The net primary impact in combination with the behavioural response is equal to the expected net fiscal impact on the government’s budget balance.

PBO estimates that the net fiscal impact of the first two changes will reduce PIT revenues by $0.4 billion in 2015-16 and about $1.7 billion annually on average from 2016-17 to 2020-21. That is, the estimated revenue gains from introducing a new tax rate of 33.0 per cent on taxable income over $200,000 fall short of covering the estimated loss in revenues from reducing the PIT rate on the second tax bracket by $8.9 billion from 2015-16 to 2020-21. Reducing the first personal income tax rate from 15.0 to 14.0 per cent would reduce revenue by $0.9 billion in 2015-16 and about $4.1 billion on average annually from 2016-17 to 2020-21.

Introducing the new tax bracket for taxable income over $200,000 at a rate of 33.0 per cent will affect taxpayers in the top decile.  The top 1.4 per cent of taxpayers will pay an additional $5,255 on average. The second bracket change will affect 43 per cent of taxpayers, and primarily the top 30 per cent of earners.  The first bracket change will affect the most number of taxpayers with tax savings distributed across the top 60 per cent of earners.

Source: The Fiscal and Distributional Impact of Changes to the Federal Personal Income Tax Regime

Household Indebtedness and Financial Vulnerability

Get the report
Household Indebtedness and Financial Vulnerability.pdf

Get the data
Figures_Data.xlsx

Summary
This report reviews the evolution of household indebtedness in Canada and assesses prospects for household financial vulnerability over the medium term. The assessment, however, is based on financial indicators that represent economy-wide averages, which can mask wide variation across households. An assessment of financial vulnerability based on household microdata is beyond the scope of this report.

The indebtedness of Canadian households continues to trend higher. In the third quarter of 2015, total household debt (i.e., credit market debt plus trade payables) reached 171 per cent of disposable income. In other words, for every $100 of disposable income, households had debt obligations of $171. This is the highest level recorded since 1990.

  • Among G7 countries, Canada has experienced the largest increase in household debt relative to income since 2000. Households in Canada have become more indebted than any other G7 country over recent history.
  • Measured relative to household assets, household debt has moderated in recent years. In the third quarter of 2015, household debt accounted for 17.0 per cent of household assets. But this was still above the average of 15.4 per cent prior to the global financial crisis.
  • Analysis conducted at the Bank of Canada suggests that low interest rates, higher house prices and financial innovation have contributed to the increase in household indebtedness.

Policymakers continue to express concern about the vulnerability of households to economic shocks, such as unexpected job loss or higher-than-expected interest rates. While the household debt-to-income ratio provides an indication of household indebtedness and facilitates international comparisons, it provides a limited measure of household financial vulnerability.

What matters more for financial vulnerability is not so much the level of the debt relative to income, but rather the capacity of households to meet their debt service obligations. A financially vulnerable household is one that is required to devote a substantial portion of its income to service its debt. It faces greater exposure to negative income and interest rate shocks, and is more likely to be delinquent in its debt payments.

Financial vulnerability is typically measured by the debt service ratio (DSR), that is, household debt payments expressed relative to disposable income. In this report, we adopt Statistics Canada’s concept and measure of obligated debt payments, which includes required principal and interest payments, but excludes debt prepayments.

Based on PBO’s November 2015 Economic and Fiscal Outlook, we project that household debt will continue to rise, reaching 174 per cent of disposable income in late 2016, before returning close to current levels by the end of 2020.

Household debt-servicing capacity will become stretched further as interest rates rise to “normal” levels over the next five years. By the end of 2020, the total household DSR, that is principal plus interest, is projected to increase from 14.1 per cent of disposable income in the third quarter of 2015 to 15.9 per cent.

Household debt service ratios

Based on PBO’s projection, the financial vulnerability of the average household would rise to levels beyond historical experience.

  • The projected increase in the total DSR to 15.9 per cent would be 3.1 percentage points above the long-term historical average of 12.8 per cent (from 1990Q1 to 2015Q3). It would also be almost one full percentage point above its highest level over the past 25 years, 14.9 per cent, which was reached in 2007Q4.

Analysis conducted at the Bank of Canada (see Djoudad (2012)) indicates that an increase in the DSR “would imply that households are more vulnerable to negative shocks to income or to interest rates, making household balance sheets more precarious and having a negative impact on financial institutions”.

Source: Household Indebtedness and Financial Vulnerability

Estimate of financial support provided to disabled Veterans under the New Veterans Charter

Capture678

Estimate of financial support provided to disabled Veterans under the New Veterans Charter

Get the report

Estimate of financial support provided to disabled Veterans under the New Veterans Charter.pdf

Changes to the New Veterans Charter

The House of Commons approved a number of enhancements to benefits provided to Veterans under the New Veterans Charter (NVC), as part of the Economic Action Plan 2015 Act, No. 1 (Bill C-59). PBO estimates the new post-65 Retirement Income Security Benefit (RISB) and the higher Earnings Loss Benefit (ELB) income threshold for part-time reservists will increase VAC’s program expenditures by $231.6 million over 10 years.  That means the total cost of providing financial benefits for disabled Veterans, including these two enhancements, is estimated at nearly $3.3 billion over the next 10 years.

Continuing cost of the mission in Afghanistan

Afghanistan Veterans make-up 18 per cent of disabled Veterans receiving NVC benefits. For the period between 2015 and 2025, PBO estimates the cost of providing financial support to Veterans who served in Afghanistan at $157.0 million.

Afghanistan Veterans are three times more likely to have a mental health diagnosis. This group is 20 years younger than those without Afghanistan service (with an average age of 41 v. 61) and will continue to collect benefits while pension earnings will offset the cost of the benefits paid to the non-Afghanistan group. Consequently, benefits paid to Veterans with mental health conditions will exceed those of Veterans with musculoskeletal conditions by 2017.

Cost of future combat missions

PBO developed a methodology for estimating the cost of providing financial benefits to Veterans of future conflicts. The estimated cost of Veterans disability benefits as a result of a single year  of military operations similar to those experienced in Afghanistan in 2007, would be $145.2 million over the period of 2017 to 2025.

Source: Estimate of financial support provided to disabled Veterans under the New Veterans Charter