Trudeau popularity hits new heights in Nanos tracking (ending November 20, 2015)

Nanos Weekly Leadership Tracking

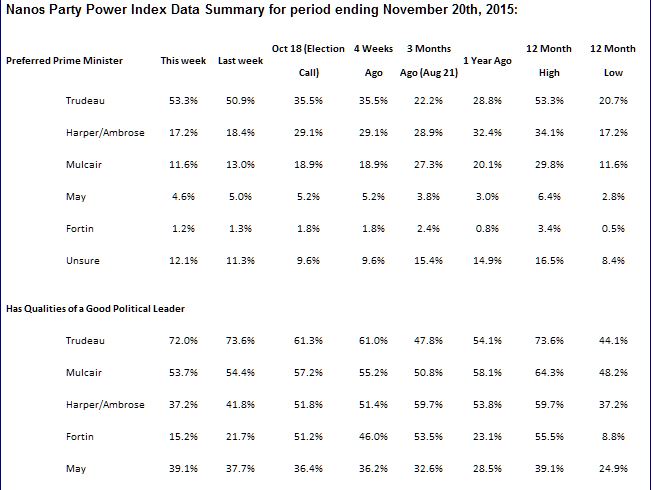
  • Preferred Prime Minister – Asked who their preferred choice for Prime Minister was, 53.3% of Canadians said Trudeau – who continues to track upward following his election victory, followed by Harper/Ambrose at 17.2% (tracking includes two weeks for Harper and two for Ambrose), Mulcair at 11.6% (a new one year low), May at 4.6% and 12.1% were unsure.
  • Qualities of a Good Political Leader – Asked a series of independent questions for each leader, 72.0% of Canadians said Trudeau had the qualities of a good political leader followed by Mulcair who received 53.7% on this measure, May 39.1% and Ambrose/Harper at 37.2% of Canadians.

The team at Nanos in conjunction with Klipfolio have launched our new live political data portal where you run the numbers you want and can explore the trends and data you need.  This is part of our campaign, not only to provide the most reliable data to Canadians but to let them use it as they wish. We were the first to do nightly tracking and now we are the first research organization to post live public opinion data for Canadians.

We were the first to do nightly tracking and now we are the first research organization to post live public opinion data for Canadians. Here’s the link to check it out

To view the detailed tracking visit our website.

Methodology

The views of 1,000 respondents are compiled into a party power brand index for each party that goes from 0 to 100, where 0 means that the party has no brand power and 100 means it has maximum brand power. A score above 50 is an indication of brand power for the party and its leader at this time.

The important factors in this weekly tracking include the direction of the brand strength or weakness and also the brand power of one federal party relative to another.

The data is based on random telephone interviews with 1,000 Canadians, using a four week rolling average of 250 respondents each week, 18 years of age and over. The random sample of 1,000 respondents may be weighted by age and gender using the latest census information for Canada, and the sample is geographically stratified to be representative of Canada.

The interviews are compiled into a four week rolling average of 1,000 interviews where each week, the oldest group of 250 interviews is dropped and a new group of 250 interviews is added. The current wave of tracking is based on a four-week rolling average of 1,000 Canadians (250 per week) ending November 20th.

A random telephone survey of 1,000 Canadians is accurate 3.1 percentage points, plus or minus, 19 times out of 20.

All references or use of this data must cite “Nanos Party Power Index” as the source.

Capture2ew


Trudeau hits yet another high as preferred Prime Minister (ending November 13, 2015)

Nanos Weekly Leadership Tracking

  • Preferred Prime Minister – Trudeau’s numbers on the preferred Prime Minister measure continue to climb.  In the wake of the federal election and the Liberal win, Trudeau’s numbers continue to climb – 50.9% of Canadians prefer Trudeau as PM followed by Harper/Ambrose at 18.4%, Mulcair at 13.0%, May at 5.0% (11.3% were undecided).  Readers should note this is the first week of tracking which included Interim Conservative leader Rona Ambrose and it will take another three waves of tracking to fully transition from Harper to Ambrose.
  • Qualities of a Good Political Leader – The proportion of Canadians who believe Trudeau has the qualities of a good political leader have now risen to 73.6% – a new high for Trudeau.

The team at Nanos in conjunction with Klipfolio have launched our new live political data portal where you run the numbers you want and can explore the trends and data you need.  This is part of our campaign, not only to provide the most reliable data to Canadians but to let them use it as they wish. We were the first to do nightly tracking and now we are the first research organization to post live public opinion data for Canadians.

We were the first to do nightly tracking and now we are the first research organization to post live public opinion data for Canadians. Here’s the link to check it out 

To view the detailed tracking visit our website.

Methodology

The views of 1,000 respondents are compiled into a party power brand index for each party that goes from 0 to 100, where 0 means that the party has no brand power and 100 means it has maximum brand power. A score above 50 is an indication of brand power for the party and its leader at this time.

The important factors in this weekly tracking include the direction of the brand strength or weakness and also the brand power of one federal party relative to another.

The data is based on random telephone interviews with 1,000 Canadians, using a four week rolling average of 250 respondents each week, 18 years of age and over. The random sample of 1,000 respondents may be weighted by age and gender using the latest census information for Canada, and the sample is geographically stratified to be representative of Canada. 

The interviews are compiled into a four week rolling average of 1,000 interviews where each week, the oldest group of 250 interviews is dropped and a new group of 250 interviews is added. The current wave of tracking is based on a four-week rolling average of 1,000 Canadians (250 per week) ending November 13th.

A random telephone survey of 1,000 Canadians is accurate 3.1 percentage points, plus or minus, 19 times out of 20.

All references or use of this data must cite “Nanos Party Power Index” as the source.

image

Expectations Sub-indice in Canada hits one year high, sentiment up in every region except energy-rich Prairie provinces (released November 9, 2015)

 image

Bloomberg Nanos Weekly Consumer Confidence Tracking

Consumer sentiment in Canada continues to trend upward in the post election period according to the Bloomberg Nanos Canadian Consumer Confidence Index.  The main index, sub-indices and each individual variable realized upward pressure this week in the Nanos tracking for Bloomberg.

“Consumer sentiment was up this week in every region of the country in Canada except the energy-rich Prairie provinces”, said Nanos Research Group Chairman Nik Nanos.

“The prospect of a fiscal stimulus and recent economic news–including upticks in the labor market and upside momentum in Canada’s non-energy exports–have been adding to the improvement in household expectations. Household attitudes toward spending are lagging, however, and less likely to improve until there are signs of wage growth”, said Robert Lawrie of Bloomberg Economics.

The BNCCI, a composite of a weekly measure of financial health and economic expectations, registered at 58.31 compared with last week’s 57.92. The twelve month high stands at 58.31.

The Bloomberg Nanos Pocketbook Index is based on survey responses to questions on personal finances and job security. This sub-indice was at 59.50 this week compared to 59.31 the previous week. The Bloomberg Nanos Expectations Index, based on surveys for the outlook for the economy and real estate prices, was at 57.11 this week (compared to 56.53 last week).

The average for the BNCCI since 2008 has been 56.74 with a low of 43.28 in December 2008 and a high of 62.92 in December 2009. The index has averaged 55.33 this year.

To view the weekly tracking visit our website

Methodology

The BNCCI is produced by the Nanos Research Corporation, headquartered in Canada,  which operates in Canada and the United States.  The data is based on random telephone interviews with 1,000 Canadian consumers (land- and cell-lines), using a four week rolling average of 250 respondents each week, 18 years of age and over. The random sample of 1,000 respondents may be weighted by age and gender using the latest census information for Canada and the sample is geographically stratified to be representative of Canada. The interviews are compiled into a four week rolling average of 1,000 interviews where each week, the oldest group of 250 interviews is dropped and a new group of 250 interviews is added. The views of 1,000 respondents are compiled into a diffusion index from 0 to 100. A score of 50 on the diffusion index indicates that positive and negative views are a wash while scores above 50 suggest net positive views, while those below 50 suggest net negative views in terms of the economic mood of Canadians.

A random telephone survey of 1,000 consumers in Canada is accurate 3.1 percentage points, plus or minus, 19 times out of 20.

All references or use of this data must cite Bloomberg Nanos as the source.

image

Comparison of Federal Election Results to Nanos Estimates -CORRECTED

When the final votes were tallied the Nanos tracking was even closer!

Check it out.  Sorry about that.  

Here is a comparison of the election results to the Nanos data using the Election Canada data as of 10:30 am Tuesday October 20th.

Comparison of Federal Election Results to Nanos Estimates

b5ad68c8-9ced-4798-b6a2-6a4139d994a4

An election is a torture chamber for politicians, voters and pollsters – and rightly so. 

At Nanos we take very seriously our responsibility as a research firm and the trust Canadians place in our numbers. In addition to the exceptional coverage by our clients — CTV News and the Globe and Mail, and Bloomberg News — the Nanos numbers were cited by virtually all major media outlets in Canada and several international ones such as by The Associated Press, The Wall Street Journal, The Washington Post, the Los Angeles Times, the Guardian Newspaper in the UK and the BBC.

Over the course of the election, the Nanos numbers were also a central part of the dialogue on social media.  For example, our polling was cited in 55.2 million tweets during the campaign.

A review of our tracking in Canada’s 42nd federal election suggests that the Nanos track record of reliability in national and provincial elections continues from strength to strength.  Our approach of using random land- and cell-line samples with live agents, in our opinion, remains the most consistently robust means of measuring opinion.

Here is a comparison of the election results to the Nanos data using the Election Canada data as of 1:20 am ET.

89f4e9e3-ab45-4088-bde4-b7bc2596e9a6

As you can see, this contributes to the Nanos track record which is among the most consistently accurate for national and provincial elections in Canada. 

For this federal election, Nanos accurately called the winner in all regions, the results for every party were well within the margin of error and accurately forecast the Liberal victory.