Liberals near 12 month high, Conservatives at 12 month low in Nanos Index (ending December 24, 2015)

The Nanos Party Power Index

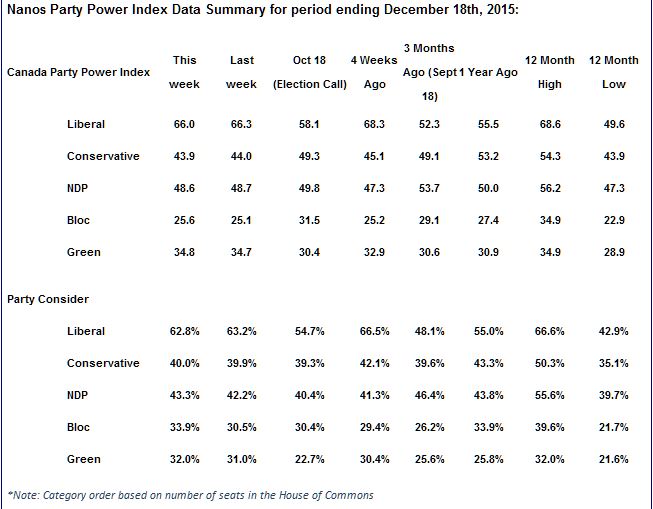
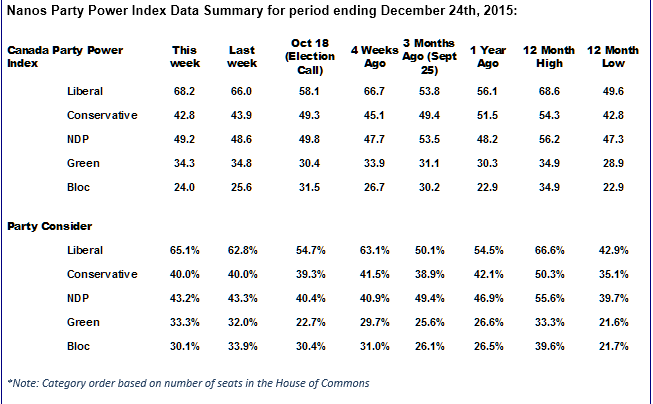
  • Nanos Party Power Index – The Index, which is a composite of a series of question on ballot preferences and impressions of the leaders has the federal Liberal Party remaining near a one year high over the holiday period.  The Liberals scored 68.2 out of a possible 100 points, followed by the New Democrats who scored 49.2 points, the Conservatives 42.8 points, the Greens 34.2 points and the BQ 24.0 points (QC only).  Of note, the Conservatives hit a 12 month low over the holidays.
  • Accessible Voters – Asked a series of independent questions for each party, about two of three Canadians would consider voting Liberal (65.1%) while 43.2% would consider voting NDP, 40.0% would consider voting Conservative, 33.3% would consider voting Green and 30.1% of Quebecers would consider voting BQ.

The team at Nanos in conjunction with Klipfolio have launched our new live political data portal where you run the numbers you want and can explore the trends and data you need.  This is part of our campaign, not only to provide the most reliable data to Canadians but to let them use it as they wish. We were the first to do nightly tracking and now we are the first research organization to post live public opinion data for Canadians. Here’s the link to check it out.

To view the detailed tracking visit our website.

Methodology

The views of 1,000 respondents are compiled into a party power brand index for each party that goes from 0 to 100, where 0 means that the party has no brand power and 100 means it has maximum brand power. A score above 50 is an indication of brand power for the party and its leader at this time.

The important factors in this weekly tracking include the direction of the brand strength or weakness and also the brand power of one federal party relative to another.

The data is based on random telephone interviews with 1,000 Canadians, using a four week rolling average of 250 respondents each week, 18 years of age and over. The random sample of 1,000 respondents may be weighted by age and gender using the latest census information for Canada, and the sample is geographically stratified to be representative of Canada.

The interviews are compiled into a four week rolling average of 1,000 interviews where each week, the oldest group of 250 interviews is dropped and a new group of 250 interviews is added. The current wave of tracking is based on a four-week rolling average of 1,000 Canadians (250 per week) ending December 24th.

A random telephone survey of 1,000 Canadians is accurate 3.1 percentage points, plus or minus, 19 times out of 20.

All references or use of this data must cite “Nanos Party Power Index” as the source.

screenshot-{domain} {date} {time}

Liberals continue to enjoy advantage on Nanos Index and in accessible voters (ending December 18, 2015)

The Nanos Party Power Index

  • Nanos Party Power Index – The Index, which is a composite of a series of questions including ballot preferences and perceptions of the federal parties leaders still has the Liberals with strong brand scores. The Liberals scored 66.0 out of a possible 100 points, near their 12 month high of 68.6 points, the NDP scored 48.6 points, the Conservatives 43.9 points, the Greens 34.8 points and the BQ 25.6 points (QC only).
  • Accessible Voters – More than six of ten Canadians (62.8%) would consider voting Liberal compared to 43.3% who would consider voting NDP, 40.0% who would consider voting Conservative, and 32.0% who would consider voting Green – a new 12 month high for the Green Party of Canada.

The team at Nanos in conjunction with Klipfolio have launched our new live political data portal where you run the numbers you want and can explore the trends and data you need.  This is part of our campaign, not only to provide the most reliable data to Canadians but to let them use it as they wish. We were the first to do nightly tracking and now we are the first research organization to post live public opinion data for Canadians. Here’s the link to check it out

To view the detailed tracking visit our website.

Methodology

The views of 1,000 respondents are compiled into a party power brand index for each party that goes from 0 to 100, where 0 means that the party has no brand power and 100 means it has maximum brand power. A score above 50 is an indication of brand power for the party and its leader at this time.

The important factors in this weekly tracking include the direction of the brand strength or weakness and also the brand power of one federal party relative to another.

The data is based on random telephone interviews with 1,000 Canadians, using a four week rolling average of 250 respondents each week, 18 years of age and over. The random sample of 1,000 respondents may be weighted by age and gender using the latest census information for Canada, and the sample is geographically stratified to be representative of Canada.

The interviews are compiled into a four week rolling average of 1,000 interviews where each week, the oldest group of 250 interviews is dropped and a new group of 250 interviews is added. The current wave of tracking is based on a four-week rolling average of 1,000 Canadians (250 per week) ending December 18th.

A random telephone survey of 1,000 Canadians is accurate 3.1 percentage points, plus or minus, 19 times out of 20.

All references or use of this data must cite “Nanos Party Power Index” as the source.

nanosparty

Liberals still quite strong on Nanos Index but incrementally slide (ending December 11, 2015)

The Nanos Party Power Index

  • Nanos Party Power Index – The Index which is a compilation of a series of questions on ballot preferences and the impressions of the federal leaders still has the Liberals with the strongest comparable score but sliding.  The Liberals scored 66.3 out of a possible 100 points on the Index followed by the NDP with 48.7 points, the Conservatives with 44.0 points, the Greens with 34.7 points and the BQ with 25.1 points (Quebec only).
  • Accessible Voters – Asked independent questions for each federal party as to whether they would consider or not consider voting for that party, 63.2% of Canadians would consider voting Liberal, 42.2% would consider voting NDP, 39.9% would consider voting Conservative, and 31.0% would consider voting Green.

The team at Nanos in conjunction with Klipfolio have launched our new live political data portal where you run the numbers you want and can explore the trends and data you need.  This is part of our campaign, not only to provide the most reliable data to Canadians but to let them use it as they wish. We were the first to do nightly tracking and now we are the first research organization to post live public opinion data for Canadians. Here’s the link to check it out 

To view the detailed tracking visit our website.

Methodology

The views of 1,000 respondents are compiled into a party power brand index for each party that goes from 0 to 100, where 0 means that the party has no brand power and 100 means it has maximum brand power. A score above 50 is an indication of brand power for the party and its leader at this time.

The important factors in this weekly tracking include the direction of the brand strength or weakness and also the brand power of one federal party relative to another.

The data is based on random telephone interviews with 1,000 Canadians, using a four week rolling average of 250 respondents each week, 18 years of age and over. The random sample of 1,000 respondents may be weighted by age and gender using the latest census information for Canada, and the sample is geographically stratified to be representative of Canada. 

The interviews are compiled into a four week rolling average of 1,000 interviews where each week, the oldest group of 250 interviews is dropped and a new group of 250 interviews is added. The current wave of tracking is based on a four-week rolling average of 1,000 Canadians (250 per week) ending December 11th.

A random telephone survey of 1,000 Canadians is accurate 3.1 percentage points, plus or minus, 19 times out of 20.

All references or use of this data must cite “Nanos Party Power Index” as the source.


image

Liberal brand strongest in Nanos Party Power Index (ending December 4, 2015)

The Nanos Party Power Index

  • Nanos Party Power Index – The Index, which is comprised of a series of questions on vote preferences and impressions of the leaders has the Liberal brand still riding high in the post election period.  The Liberals scored 67.6 out of a possible 100 points on the Index, followed by the NDP who scored 48.4 points, the Conservatives 44.3 points, the Green Party at 34.2 points and the BQ at 25.9 points (Quebec only).
  • Accessible Voters – Asked a series of independent questions for each party, 64.6% of Canadians would consider voting Liberal, 42.1% would consider voting NDP, 41.1% would consider voting Conservative, and 30% would consider voting Green.

The team at Nanos in conjunction with Klipfolio have launched our new live political data portal where you run the numbers you want and can explore the trends and data you need.  This is part of our campaign, not only to provide the most reliable data to Canadians but to let them use it as they wish. We were the first to do nightly tracking and now we are the first research organization to post live public opinion data for Canadians. Here’s the link to check it out

To view the detailed tracking visit our website.

Methodology

The views of 1,000 respondents are compiled into a party power brand index for each party that goes from 0 to 100, where 0 means that the party has no brand power and 100 means it has maximum brand power. A score above 50 is an indication of brand power for the party and its leader at this time.

The important factors in this weekly tracking include the direction of the brand strength or weakness and also the brand power of one federal party relative to another.

The data is based on random telephone interviews with 1,000 Canadians, using a four week rolling average of 250 respondents each week, 18 years of age and over. The random sample of 1,000 respondents may be weighted by age and gender using the latest census information for Canada, and the sample is geographically stratified to be representative of Canada.

The interviews are compiled into a four week rolling average of 1,000 interviews where each week, the oldest group of 250 interviews is dropped and a new group of 250 interviews is added. The current wave of tracking is based on a four-week rolling average of 1,000 Canadians (250 per week) ending December 4th.

A random telephone survey of 1,000 Canadians is accurate 3.1 percentage points, plus or minus, 19 times out of 20.

All references or use of this data must cite “Nanos Party Power Index” as the source.

Capture

Liberals top in accessible voters but realize a decline in Nanos tracking (ending November 27, 2015)

b5ad68c8-9ced-4798-b6a2-6a4139d994a4

The Nanos Party Power Index

  • Nanos Party Power Index – The Index, which is a compilation of a series of questions on vote preferences and impressions of the federal party leaders still has the Liberals with a strong score, although it has declined.  The Liberals scored 66.7 out of a possible 100 points followed by the NDP who scored 47.7 points, the Conservatives with 45.1 points, the Greens with 33.9 points and the BQ with 26.7 points (QC only).
  • Accessible Voters – Although still registering the largest pool of accessible voters, the Liberals registered a one week three point drop with 63.1% of Canadians saying they would consider voting Liberal compared to 41.5% who would consider voting Conservative, 40.9% who would consider voting NDP and 29.7% who would consider voting Green.

The team at Nanos in conjunction with Klipfolio have launched our new live political data portal where you run the numbers you want and can explore the trends and data you need.  This is part of our campaign, not only to provide the most reliable data to Canadians but to let them use it as they wish. We were the first to do nightly tracking and now we are the first research organization to post live public opinion data for Canadians. Here’s the link to check it out

To view the detailed tracking visit our website.

Methodology

The views of 1,000 respondents are compiled into a party power brand index for each party that goes from 0 to 100, where 0 means that the party has no brand power and 100 means it has maximum brand power. A score above 50 is an indication of brand power for the party and its leader at this time.

The important factors in this weekly tracking include the direction of the brand strength or weakness and also the brand power of one federal party relative to another.

The data is based on random telephone interviews with 1,000 Canadians, using a four week rolling average of 250 respondents each week, 18 years of age and over. The random sample of 1,000 respondents may be weighted by age and gender using the latest census information for Canada, and the sample is geographically stratified to be representative of Canada.

The interviews are compiled into a four week rolling average of 1,000 interviews where each week, the oldest group of 250 interviews is dropped and a new group of 250 interviews is added. The current wave of tracking is based on a four-week rolling average of 1,000 Canadians (250 per week) ending November 27th.

A random telephone survey of 1,000 Canadians is accurate 3.1 percentage points, plus or minus, 19 times out of 20.

All references or use of this data must cite “Nanos Party Power Index” as the source.

nanos1