Kazenelson is the first person sentenced to serve time in jail since the federal government passed Bill C-45, also known as the Westray bill, in March 2004.
What activists may not know is how the court goes about deciding Kazenelson’s fate in this case.
Let’s review the details:
Kazenelson was the project manager on a balcony restoration project at two high-rise apartment towers in Toronto for Metron Construction Inc. He was in charge of the work, and the safety of the workers.
On Christmas Eve of 2009, Metron was on a tight deadline. A $50,000 bonus was on the line to finish the work that year. Kazenelson was under pressure to finish the work. Kazenelson knew that he was sending six workers to work on a hanging platform with only two lifelines. The platform broke and five workers fell. Four of them died.
Kazenelson was convicted in June 2015 of four counts of criminal negligence causing death and one count of criminal negligence causing bodily harm.
When the time came for sentencing, here’s what the judge had to consider:
Kazenelson’s lawyer tried to argue that because the workers knew the risks, and because they weren’t ordered to work without lifelines, he should get a short sentence. The judge didn’t buy it. In his decision, the judge noted that making a manager ‘less guilty’ because the workers knew the risk, or weren’t overtly ordered to do risky work “would ignore the reality that a worker’s acceptance of dangerous working conditions is not always a truly voluntary choice.”
The judge also understood that it is the responsibility of management to make sure that workers go home safe. Section 217.1 of the Criminal Code (created by Bill C-45) says everyone who undertakes, or has the authority, to direct how a worker does their work is under a legal duty “to take reasonable steps to prevent bodily harm to that person, or any other person, arising from that work.”
This section of the law means that management must take all the steps that a person who knows the risk and how to reduce it would take. Kazenelson had taken the working at heights training offered by the Ontario government, so he knew the risks, and what kind of steps would reduce the risk.
The judge sentenced Kazenelson to three and a half years because he wanted to make clear that people in positions of authority have to take all reasonable steps to make sure that workers go home safe at the end of the day.
While the Criminal Code establishes sentences of up to life in prison from criminal negligence causing death, it is very rare for a first offender like Kazenelson, who is otherwise not of a criminal character, to get such a long sentence. The judge applied the rule that similar offences should get similar sentences, and looked at sentences for similar criminal negligence cases. As a result he decided that a jail sentence of three and a half years was necessary to show sufficient “denunciation and general deterrence” meaning he wanted to send a message to other managers in hope of deterring them from doing the same thing.
CANUCKS BANTER By Andrew Chernoff FEBRUARY 4, 2016
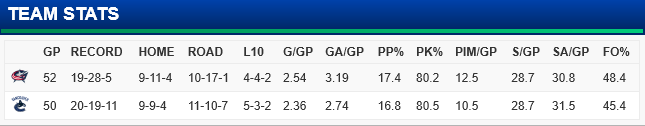
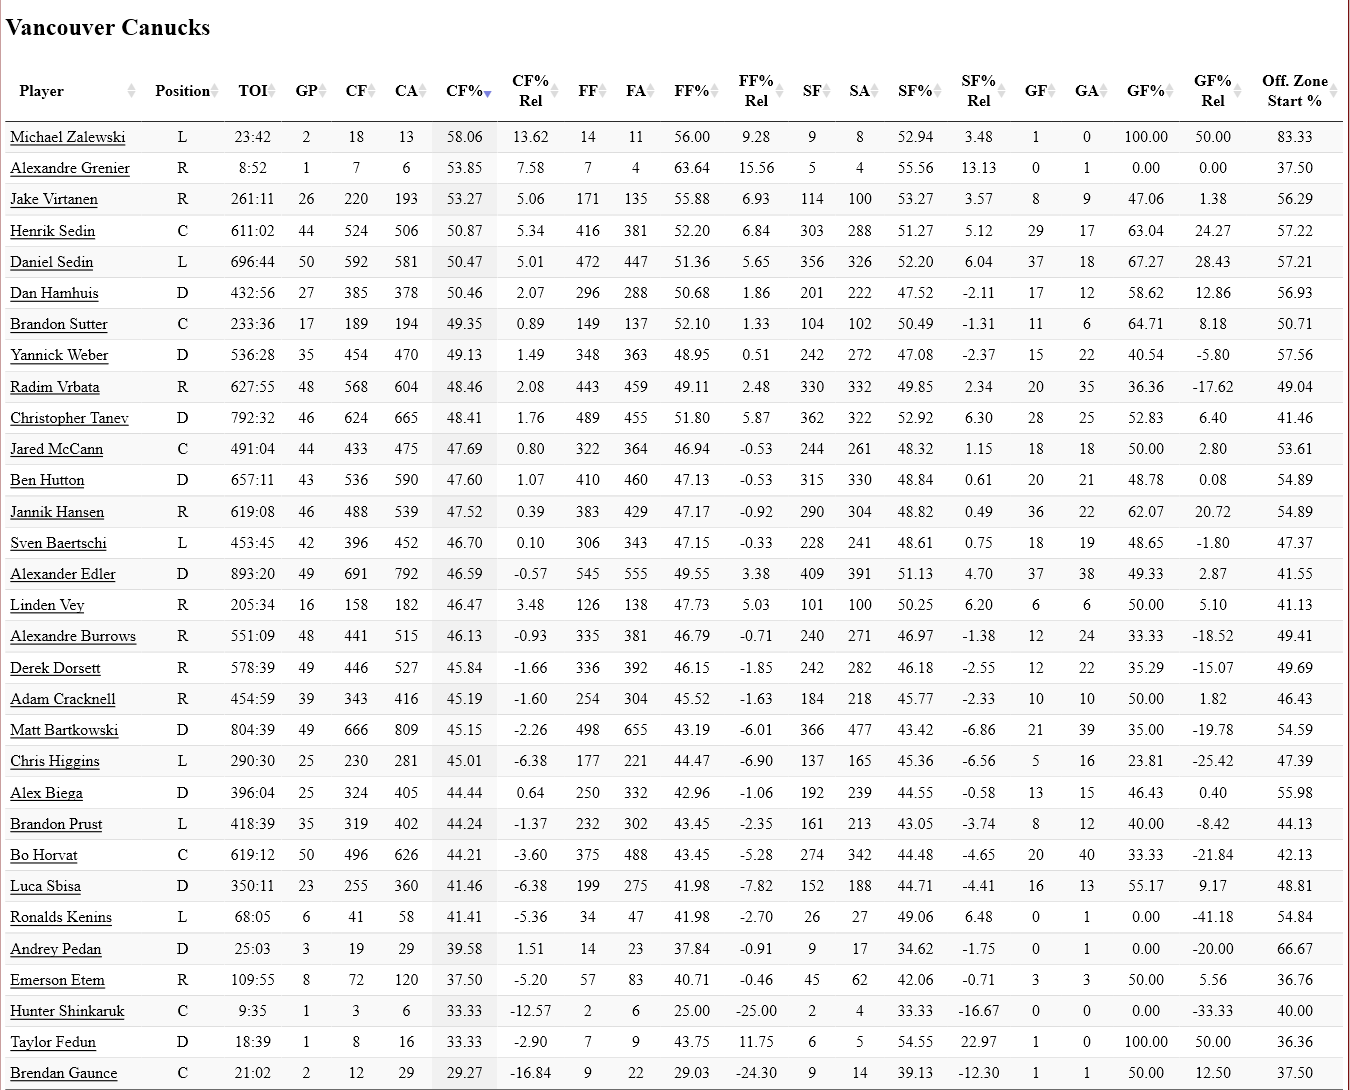
The Vancouver Canucks (20-19-11) host the Columbus Blue Jackets (19-28-5) tonight at Rogers Place, in game two of a three game home stand.
The Canucks are 6-5-1 in their last 12 home games; and 5-3-2 overall in their last 10 games.
Vancouver will try to avoid having the first goal of the game scored by their opponent tonight, as they have allowed the opening goal to their opposition in 8 consecutive home games.
Columbus visits Vancouver for game two of a three game Western Canada road trip that started Tuesday night against Edmonton, with a 5-1 loss, as Edmonton scored five unanswered goals in the last two periods, after the Blue Jackets opened up the scoring in the opening period.
The Blue Jackets are 4-6-2 in their last 12 games, including suffering four straight losses (0-3-1) in that span between January 5 and January 12.
The Canucks are 8-5-2 in their last 15 games overall; 4-3-1, at home since December 22nd.
Since January 5, Vancouver boasts the 4th-highest penalty kill percentage in the NHL at 91.7 percent.
Optional Canucks skate this morning; 13 skaters and two goalies. February 4, 2016 on Vancouver Canucks Twitter
Since December 13, the Canucks power play has been zeros and ones:
From December 13 thru January 1, the power play was 0 for 20, over 9 games and their record was 4-4-1.
Then from January 4 thru January 14, the Canucks power play had a single power play goal in five consecutive games, 5 for 16; their record, 2-2-1.
Since January 15, Vancouver has gone 6 games with zero power play goals, 0 for 8, with their record 3-2-1.
Dan Hamhuis will not play after missing 20 games with facial fractures but may be a game away from actually playing. Henrik Sedin expects to play after missing four games because of a shoulder injury, and should be in the line-up.
“We’re healthy, we have a good schedule. We just have to take care of business,”Daniel Sedin told the Canucks website. “We know we can be a really good team when everyone’s going, and we’re going to have to bring it [Thursday].”
Source: canucks.nhl.com
CANUCKS PREVIOUS GAME
In their first home game since the completion of their 6-game road trip, the Canucks fell behind early, and found it difficult to execute their game plan against the Predators, who played well in all facets of their game.
Brandon Sutter scored his first goal in 33 games on his return to the line-up from a sports hernia operation; Chris Tanev had an assist (1-7=8 in last 15 games played); Daniel Sedin picked up a helper (5-2=7 in last 12 games played); and Ryan Miller stopped 17 of 19 shots for a .895 Sv%., but it was not enough as the Canucks ended the game on the short end of the score, losing 2-1 to Nashville, to begin their 3-game home stand.
CANUCKS IN JANUARY 2016
Bo Horvat had 12 points in 12 games (7-5=12) to lead Vancouver.
Horvat scored 25.9% of the Canucks’ goals.
Henrik Sedin had 4 points in 8 games (0-4=4)
Sven Baertschi had 6 points in 10 games (4-2=6)
Chris Tanev had 6 points in 12 games (1-6=7)
Linden Vey had 6 points in 12 games (1-5=6)
Daniel Sedin had 7 points in 12 games (5-2=7)
Daniel Sedin had 5 goals in 12 games (18.5 percent of Canucks goals)
Shooting Percentage:
Sven Baertschi: 30.8 percent
Bo Horvat: 24.1 percent
Chris Tanev: 20 percent
Jannick Hansen: 20 percent
Daniel Sedin: 12.5 percent
Alex Burrows: 10.5 percent
Jake Virtanen: 7.1 percent
Canucks record in:
6-4-2=14 PTS in 12 games played (tied for 11th best in the NHL)
They have 27 goals for; 30 goals against (tied for 18th best in NHL).
They are 5 for 27 on the power play for 18.5 percent (11th best in the NHL)
Their penalty killing is 24 for 28, 85.7 percent ( 11th best in the NHL)
Face-off winning percentage is 45.6 percent (30th in the NHL)
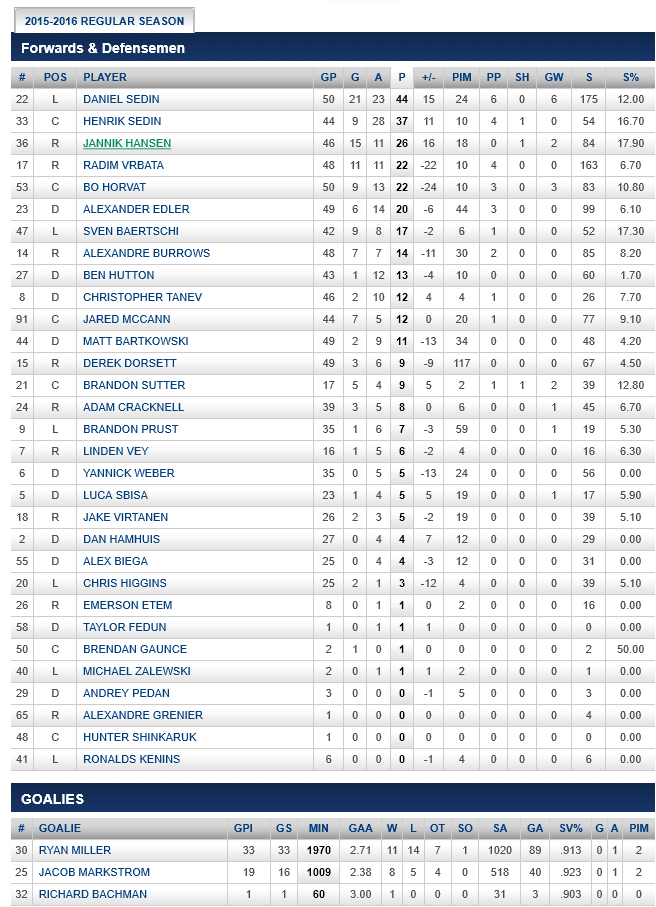
Jacob Markstrom started 7 games and was 5-1-1 with a 2.14 GAA and .931 Sv%. His GAA was 11th best and his Sv% was 13th best, minimum 4 games played.
Ryan Miller started 5 games and was 1-3-1 with a 2.56 GAA and .929 Sv%.
Canucks had 4 games of 40 or more shots against; 7 games of 30 or more shots against; and 11 games of 28 or more shots against.
Vancouver had 4 games of 30 to 38 shots for; 8 games of 25 to 38 shots for; 4 games of 20 to 23 shots for.
Canucks averaged 2.25 goals for per game; 2.50 goals against per game.
CANUCKS JOTTINGS
Canucks are averaging 2.36 goals per game. For an 82 game schedule the estimate is Vancouver will finish with 194 goals. The least number of goals ever scored by a Vancouver team in a full season of 82 games are 192 by the 1998-99 Canucks.
Canucks need to average 2.34 goal per game over their last 32 games for 193 goals, to avoid 2015-16 being the season for the least number of goals ever scored by a Vancouver team.
Canucks penalty kill is 29 for 32, 90.6 percent in their last 12 home games shorthanded for 5th best in the NHL.
Vancouver’s power play is 6 for 40, 15 percent in their last 12 home games with the man advantage, tied for 6th worst in the NHL.
Vancouver has points in 8 of its last 12 (6-4-2=14 pts) & 13 of its last 21 games (10-8-3=23 pts).
Vancouver had scored a power play goal in five straight games, where they have had at least one man advantage; they were 5 for 16 during that stretch, 31.3 percent, which ended against the Islanders.
Canucks power play is 4 for 22 in their last 10 games with the man advantage, for 18.2 percent, for 13th best in the NHL.
Vancouver’s penalty kill is 22 for 24 in their last 10 games shorthanded, for 91.7 percent, 4th best in the NHL.
Canucks penalty kill in last 15 games is 38 for 44 for 86.4 percent. The previous 15 games, they were 41 for 54 for 75.9 percent.
Vancouver sits in 5th place in the Pacific division, with 51 points and are 2 points behind both Anaheim and Arizona, in 3rd and 4rth respectively; and 5 points behind 2nd place San Jose.
Coach Desjardins said there’s little room for error the rest of the season. “It’ll be tight down the stretch here and we’re ready for that”
Source: Vancouver Canucks Twitter
COLUMBUS BLUE JACKETS NOTES (from canucks.nhl.com)
The Jackets are looking to bounce back from a 5-1 loss to Edmonton on Tuesday. Matt Calvert had the lone goal in the loss.
Since Tortorella took over as head coach, Columbus has averaged 2.64 goals per game which would put them in the top-half of the league.
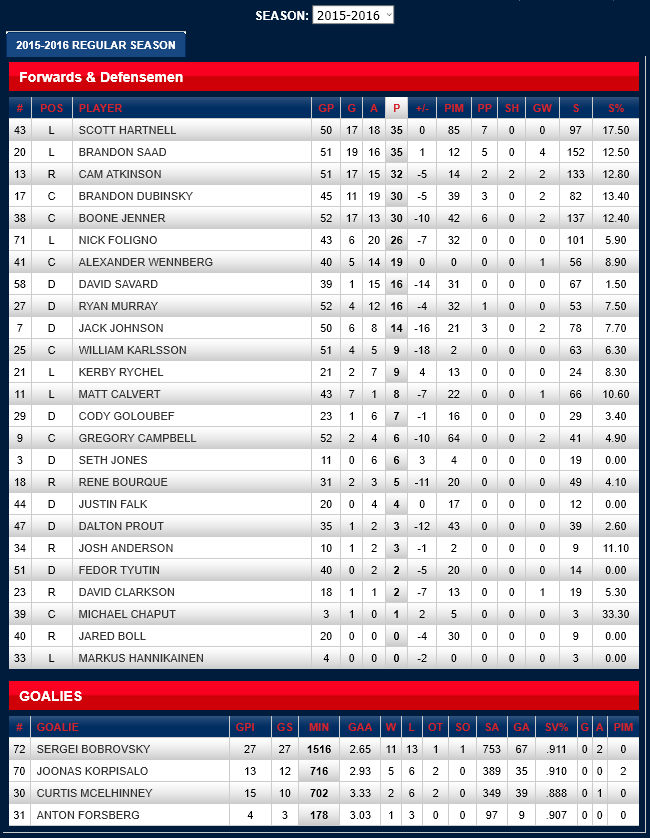
Red hot Columbus forwards lately include Brandon Saad (3 goals in last 3 games), Scott Hartnell (3-game point streak), Boone Jenner (4 points in last 3 games), Cam Atkinson (4 goals and 5 points in last 3 games), and Brandon Dubinsky (5 points in last 3 games).
Only 14 goals have come from defencemen this season for the Blue Jackets. The arrival of Seth Jones via trade from Nashville is supposed to help with that.
Goalie Joonas Korpisalo has started the last four in a row in place of the injured Sergei Bobrovsky.
Columbus has allowed a league-high 3.19 goals against per game.
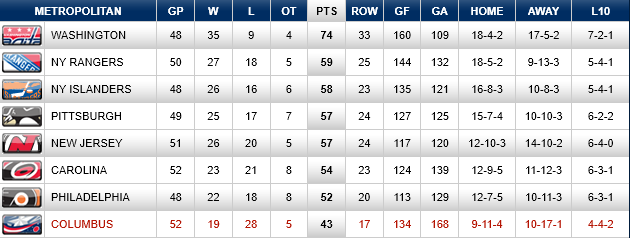
The Blue Jackets are in last place in the Metropolitan division, 15 points out of a playoff spot and 9 points behind 7th place Philadelphia.
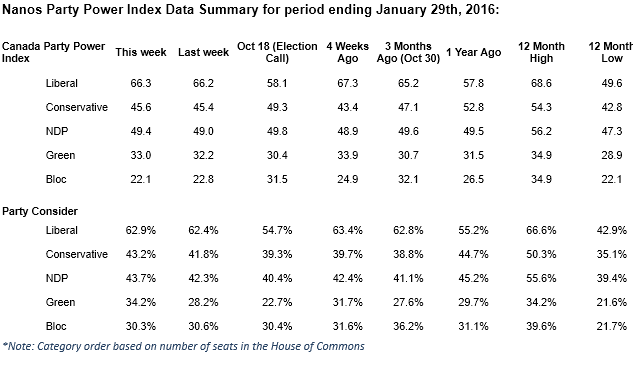
Nanos Party Power Index – The Index which is a basket of political goods made up of ballot preferences and impressions of the federal leaders has the Liberals with 66.3 out of a possible 100 points. The NDP registered 49.4 points on the Index followed by the Conservatives with 45.6 points, the Greens with 33.0 points and the BQ had 22.1 points (Quebec only).
Accessible Voters – Asked a series of independent questions for each federal political party, 62.9% of Canadians said they would consider voting Liberal, 43.7% would consider voting NDP, 43.2% would consider voting for the Conservatives, and 34.2% of Canadians would consider voting Green.
The team at Nanos in conjunction with Klipfolio have launched our new live political data portal where you run the numbers you want and can explore the trends and data you need. This is part of our campaign, not only to provide the most reliable data to Canadians but to let them use it as they wish. We were the first to do nightly tracking and now we are the first research organization to post live public opinion data for Canadians. Here’s the link to check it out.
The views of 1,000 respondents are compiled into a party power brand index for each party that goes from 0 to 100, where 0 means that the party has no brand power and 100 means it has maximum brand power. A score above 50 is an indication of brand power for the party and its leader at this time.
The important factors in this weekly tracking include the direction of the brand strength or weakness and also the brand power of one federal party relative to another.
The data is based on random telephone interviews with 1,000 Canadians, using a four week rolling average of 250 respondents each week, 18 years of age and over. The random sample of 1,000 respondents may be weighted by age and gender using the latest census information for Canada, and the sample is geographically stratified to be representative of Canada.
The interviews are compiled into a four week rolling average of 1,000 interviews where each week, the oldest group of 250 interviews is dropped and a new group of 250 interviews is added. The current wave of tracking is based on a four-week rolling average of 1,000 Canadians (250 per week) ending January 29th, 2016
A random telephone survey of 1,000 Canadians is accurate 3.1 percentage points, plus or minus, 19 times out of 20.
All references or use of this data must cite “Nanos Party Power Index” as the source.
The massive Trans-Pacific Partnership puts corporations, not Canadians, first and the federal Liberal government should not sign it.
Representatives of the 12 countries involved in the TPP are gathering in New Zealand Feb. 4 to sign the far-reaching treaty.
The deal was reached in the dying days of the Harper Conservative government and during a federal election. The full text was only made public in November. The new government is still analyzing the 6,000-page text and has yet to carry out an economic impact assessment. So why the rush to sign?
“You or I would never sign a contract without reading the fine print,” said CUPE National President Mark Hancock. “But that’s exactly what the Liberals are about to do. It’s a serious mistake that will have consequences for decades to come.”
What we already know about the TPP is bad news.
The TPP gives new rights to the world’s richest corporations, while workers and the environment lose ground. The deal supports privatization, will drive down wages, and increases the cost of health care and education. A recent study shows Canada will lose at least 58,000 jobs in the first decade under the TPP.
Independent analysis confirms the TPP is not about helping Canadian exports – 97 per cent of our exports to TPP countries are already duty-free.
The TPP extends the length of patents on prescription drugs – a move that could cost our health care system up to $630 million a year, and is a major roadblock to a universal national prescription drug program. The TPP’s longer and stricter copyright protections could mean higher costs for schools, universities and libraries.
The TPP’s investor-state dispute settlement (ISDS) system will let foreign corporations sue governments if a law or regulation interferes with their investments – and profits. Under these NAFTA-style rules, Canada is already the most-sued developed country.
“Governments, not corporations, should set our country’s laws and policies. The TPP stands in the way of immediate and bold action on climate change,” said CUPE National Secretary-Treasurer Charles Fleury.
The Harper government tried to buy its way around some of the deal’s consequences, promising billions in compensation for auto parts makers, as well as dairy, egg and chicken farmers. And the full social and economic costs of the TPP are only now being tallied.
“The TPP is a corporate rights deal. It rewrites laws and regulations in the interests of big business, at the expense of citizens and the environment,” said Hancock. “Canada should not sign this dangerous deal.”
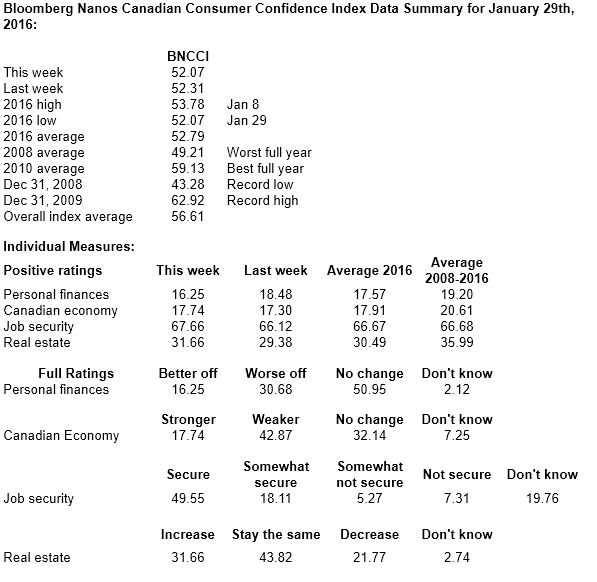
The negative trend in consumer confidence continues in Canada on multiple fronts. The Prairies have hit yet another low in confidence, and positive sentiment on personal finances realized a noticeable one week drop.
“Canadian economic sentiment continues to dampen with only 18 per cent of Canadians saying they expect the Canadian economy will get stronger in the next six months compared to 43 per cent who believe the economy will get weaker,” said Nanos Research Group Chairman Nik Nanos.
“As last fall’s election suggests, we could anticipate an improvement in consumer sentiment if and when a fiscal stimulus becomes apparent. In the meantime, consumers are contending with wage growth that remains substantially below long-term averages and employment prospects that have been deteriorating for the past 12 months”, said Robert Lawrie of Bloomberg Economics.
The BNCCI, a composite of a weekly measure of financial health and economic expectations, registered at 52.07 compared with last week’s 52.31. The twelve month high stands at 58.62.
The Bloomberg Nanos Pocketbook Index is based on survey responses to questions on personal finances and job security. This sub-indice was at 57.95 this week compared to 59.18 the previous week. The Bloomberg Nanos Expectations Index, based on surveys for the outlook for the economy and real estate prices, was at 46.19 this week (compared to 45.45 last week).
The average for the BNCCI since 2008 has been 56.61 with a low of 43.28 in December 2008 and a high of 62.92 in December 2009. The index has averaged 52.79 this year.
The BNCCI is produced by the Nanos Research Corporation, headquartered in Canada, which operates in Canada and the United States. The data is based on random telephone interviews with 1,000 Canadian consumers (land- and cell-lines), using a four week rolling average of 250 respondents each week, 18 years of age and over. The random sample of 1,000 respondents may be weighted by age and gender using the latest census information for Canada and the sample is geographically stratified to be representative of Canada. The interviews are compiled into a four week rolling average of 1,000 interviews where each week, the oldest group of 250 interviews is dropped and a new group of 250 interviews is added. The views of 1,000 respondents are compiled into a diffusion index from 0 to 100. A score of 50 on the diffusion index indicates that positive and negative views are a wash while scores above 50 suggest net positive views, while those below 50 suggest net negative views in terms of the economic mood of Canadians.
A random telephone survey of 1,000 consumers in Canada is accurate 3.1 percentage points, plus or minus, 19 times out of 20.
All references or use of this data must cite Bloomberg Nanos as the source.