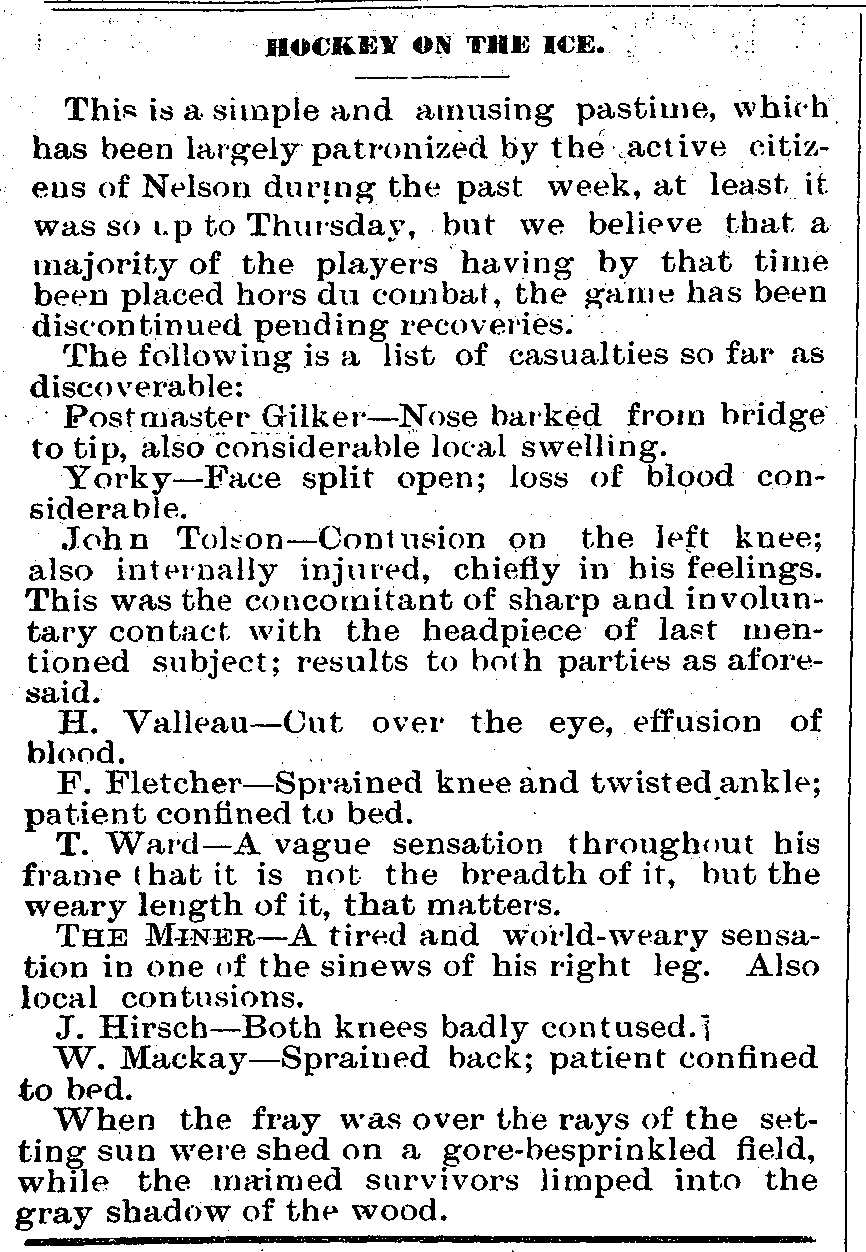
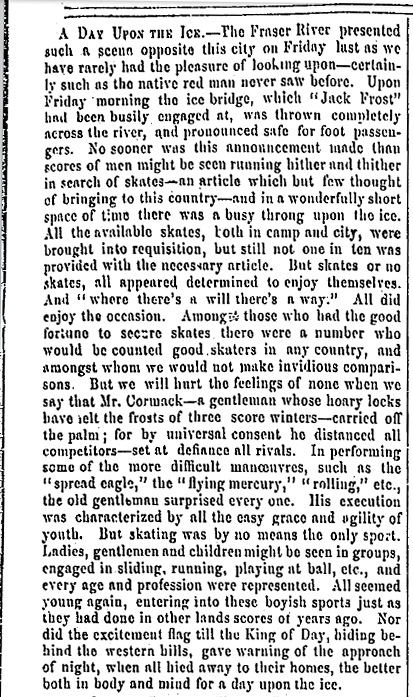
FROM: The Miner, Nelson, B.C., March 4, 1893
It seems that the earliest indication of hockey being played in the Kootenay area may have been in 1893 in Nelson, B.C., as this newspaper article recounts.

It seems that the earliest indication of hockey being played in the Kootenay area may have been in 1893 in Nelson, B.C., as this newspaper article recounts.

Canadians say they are delaying major purchases and will spend either the same or less on vacations in the current economic climate.
These observations are based on a hybrid survey commissioned by CTV News and conducted by Nanos Research. Individuals were randomly recruited (land- and cell-line sample using live agents and the survey was administered online random survey completed between January 30th and February 1st, 2016. It was comprised of 1,000 Canadians. A random survey of 1000 Canadians is accurate 3.1 percentage points plus or minus, 19 times out of 20.
The full survey results can be found by visiting our website.
Methodology
Nanos conducted an RDD dual frame (land- and cell-lines) hybrid telephone and online random survey of 1,000 Canadians between January 30th and February 1st, 2016 as part of a Canadian omnibus survey.
Participants were randomly recruited by telephone using live agents and administered a survey online. The sample included both land- and cell-lines across Canada. The results were statistically checked and weighted by age and gender using the latest Census information and the sample is geographically stratified to be representative of Canada. The research was commissioned by CTV News.
The margin of accuracy for a random sample of 1,000 Canadians is 3.1 percentage points, plus or minus, 19 times out of 20.

Nik Nanos, FMRIA
Chairman
email: nnanos@nanosresearch.com
web: http://www.nanosresearch.com
![]()
![]()
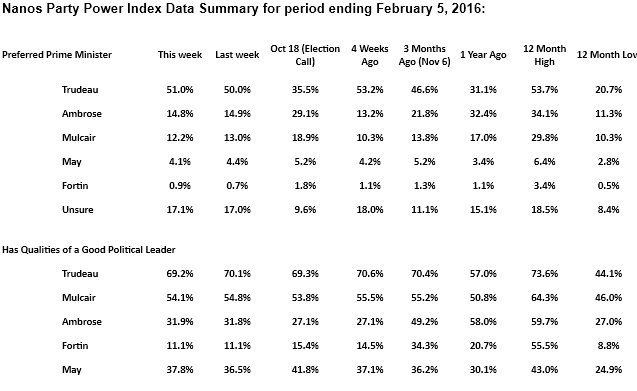
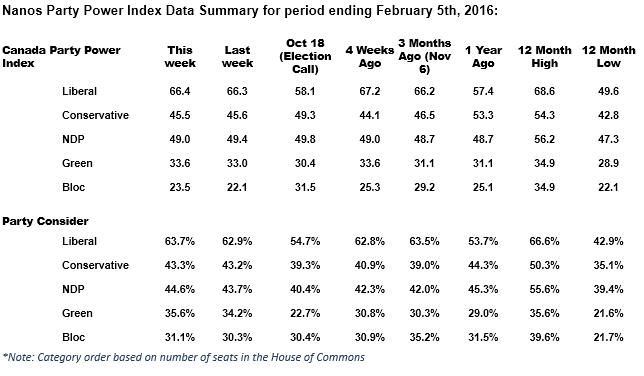
The Nanos Party Power Index
The team at Nanos in conjunction with Klipfolio have launched our new live political data portal where you run the numbers you want and can explore the trends and data you need. This is part of our campaign, not only to provide the most reliable data to Canadians but to let them use it as they wish. We were the first to do nightly tracking and now we are the first research organization to post live public opinion data for Canadians. Here’s the link to check it out.
To view the detailed tracking visit our website.
Methodology
The views of 1,000 respondents are compiled into a party power brand index for each party that goes from 0 to 100, where 0 means that the party has no brand power and 100 means it has maximum brand power. A score above 50 is an indication of brand power for the party and its leader at this time.
The important factors in this weekly tracking include the direction of the brand strength or weakness and also the brand power of one federal party relative to another.
The data is based on random telephone interviews with 1,000 Canadians, using a four week rolling average of 250 respondents each week, 18 years of age and over. The random sample of 1,000 respondents may be weighted by age and gender using the latest census information for Canada, and the sample is geographically stratified to be representative of Canada.
The interviews are compiled into a four week rolling average of 1,000 interviews where each week, the oldest group of 250 interviews is dropped and a new group of 250 interviews is added. The current wave of tracking is based on a four-week rolling average of 1,000 Canadians (250 per week) ending February 5th, 2016
A random telephone survey of 1,000 Canadians is accurate 3.1 percentage points, plus or minus, 19 times out of 20.
All references or use of this data must cite “Nanos Party Power Index” as the source.
Nanos Weekly Leadership Tracking
The team at Nanos in conjunction with Klipfolio have launched our new live political data portal where you run the numbers you want and can explore the trends and data you need. This is part of our campaign, not only to provide the most reliable data to Canadians but to let them use it as they wish. We were the first to do nightly tracking and now we are the first research organization to post live public opinion data for Canadians.
We were the first to do nightly tracking and now we are the first research organization to post live public opinion data for Canadians. Here’s the link to check it out
To view the detailed tracking visit our website.
Methodology
The views of 1,000 respondents are compiled into a party power brand index for each party that goes from 0 to 100, where 0 means that the party has no brand power and 100 means it has maximum brand power. A score above 50 is an indication of brand power for the party and its leader at this time.
The important factors in this weekly tracking include the direction of the brand strength or weakness and also the brand power of one federal party relative to another.
The data is based on random telephone interviews with 1,000 Canadians, using a four week rolling average of 250 respondents each week, 18 years of age and over. The random sample of 1,000 respondents may be weighted by age and gender using the latest census information for Canada, and the sample is geographically stratified to be representative of Canada.
The interviews are compiled into a four week rolling average of 1,000 interviews where each week, the oldest group of 250 interviews is dropped and a new group of 250 interviews is added. The current wave of tracking is based on a four-week rolling average of 1,000 Canadians (250 per week) ending February 5th.
A random telephone survey of 1,000 Canadians is accurate 3.1 percentage points, plus or minus, 19 times out of 20.
All references or use of this data must cite “Nanos Party Power Index” as the source.