Greenwood hockey team. Date: 1911. The photographer is undetermined.
 Phoenix, B.C. hockey team. Date: 1913. The photographer is undetermined. Picture courtesy of Ellen Trounsen, who was a resident of Phoenix, B.C. and Greenwood, B.C.

Greenwood hockey team. Date: 1911. The photographer is undetermined.
Phoenix, B.C. hockey team. Date: 1913. The photographer is undetermined. Picture courtesy of Ellen Trounsen, who was a resident of Phoenix, B.C. and Greenwood, B.C.
 Phoenix, B.C. Date: 193-. The photographer is undetermined.
 Phoenix, B.C. Rink. Date: ca. 1916. The photographer is undetermined.
 The Phoenix, B.C. Hospital and its staff. Date: ca. 1908. The photographer is undetermined.
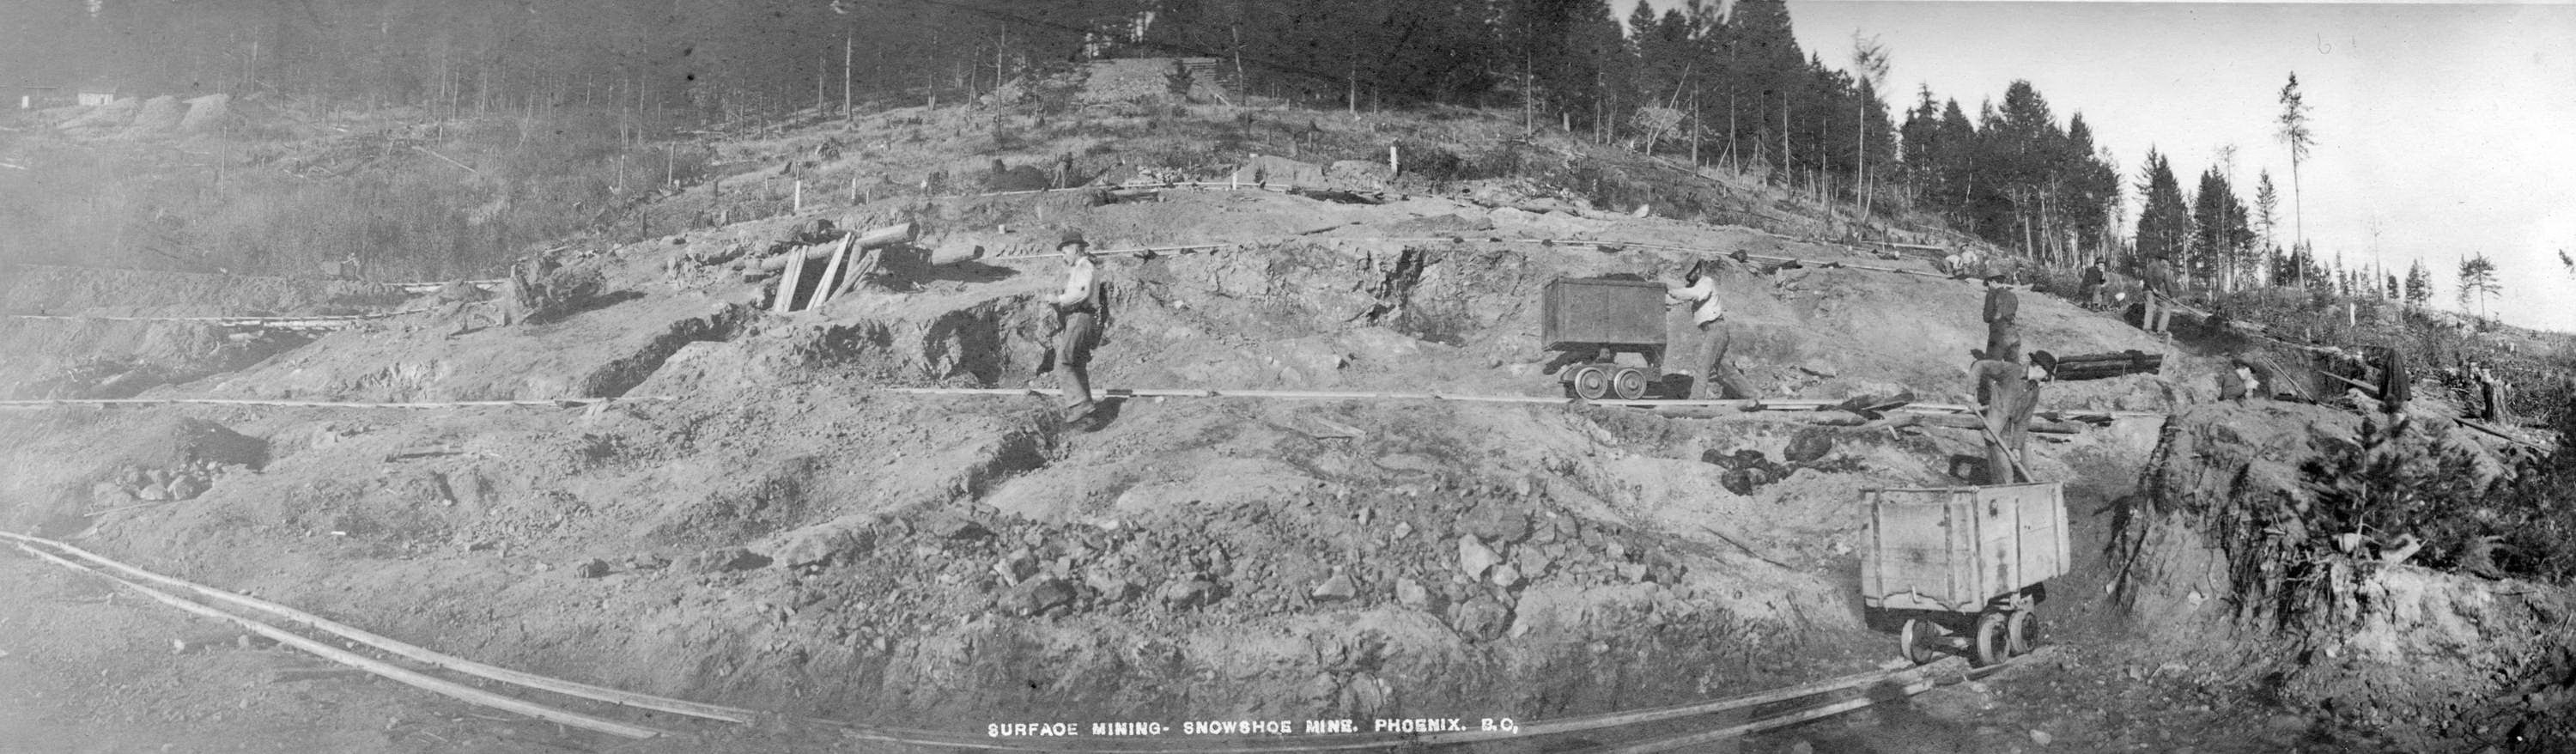
Surface Mining – Snowshoe Mine, Phoenix, B.C. Reference code AM54-S4-: LP 196.1 Dates of creation area Date(s) 1901-1902 Name of creator Matthews, James Skitt, Major (1878-1970) Donated by Mr. H.C. Fitz James on Jan. 27, 1953. Hall, William (Photographer)
![MIKAN 3307225 Greenwood, B.C. n.d. [221 KB, 1000 X 854]](https://andrewphillipchernoff.ca/wp-content/uploads/2016/02/a051392-v8.jpg)
MIKAN 3307225 Greenwood, B.C.
![MIKAN 3373745 Motherlode, Greenwood, B.C. [155 KB, 1000 X 748]](https://andrewphillipchernoff.ca/wp-content/uploads/2016/02/a045417-v8.jpg)
MIKAN 3373745 Motherlode, Greenwood, B.C.
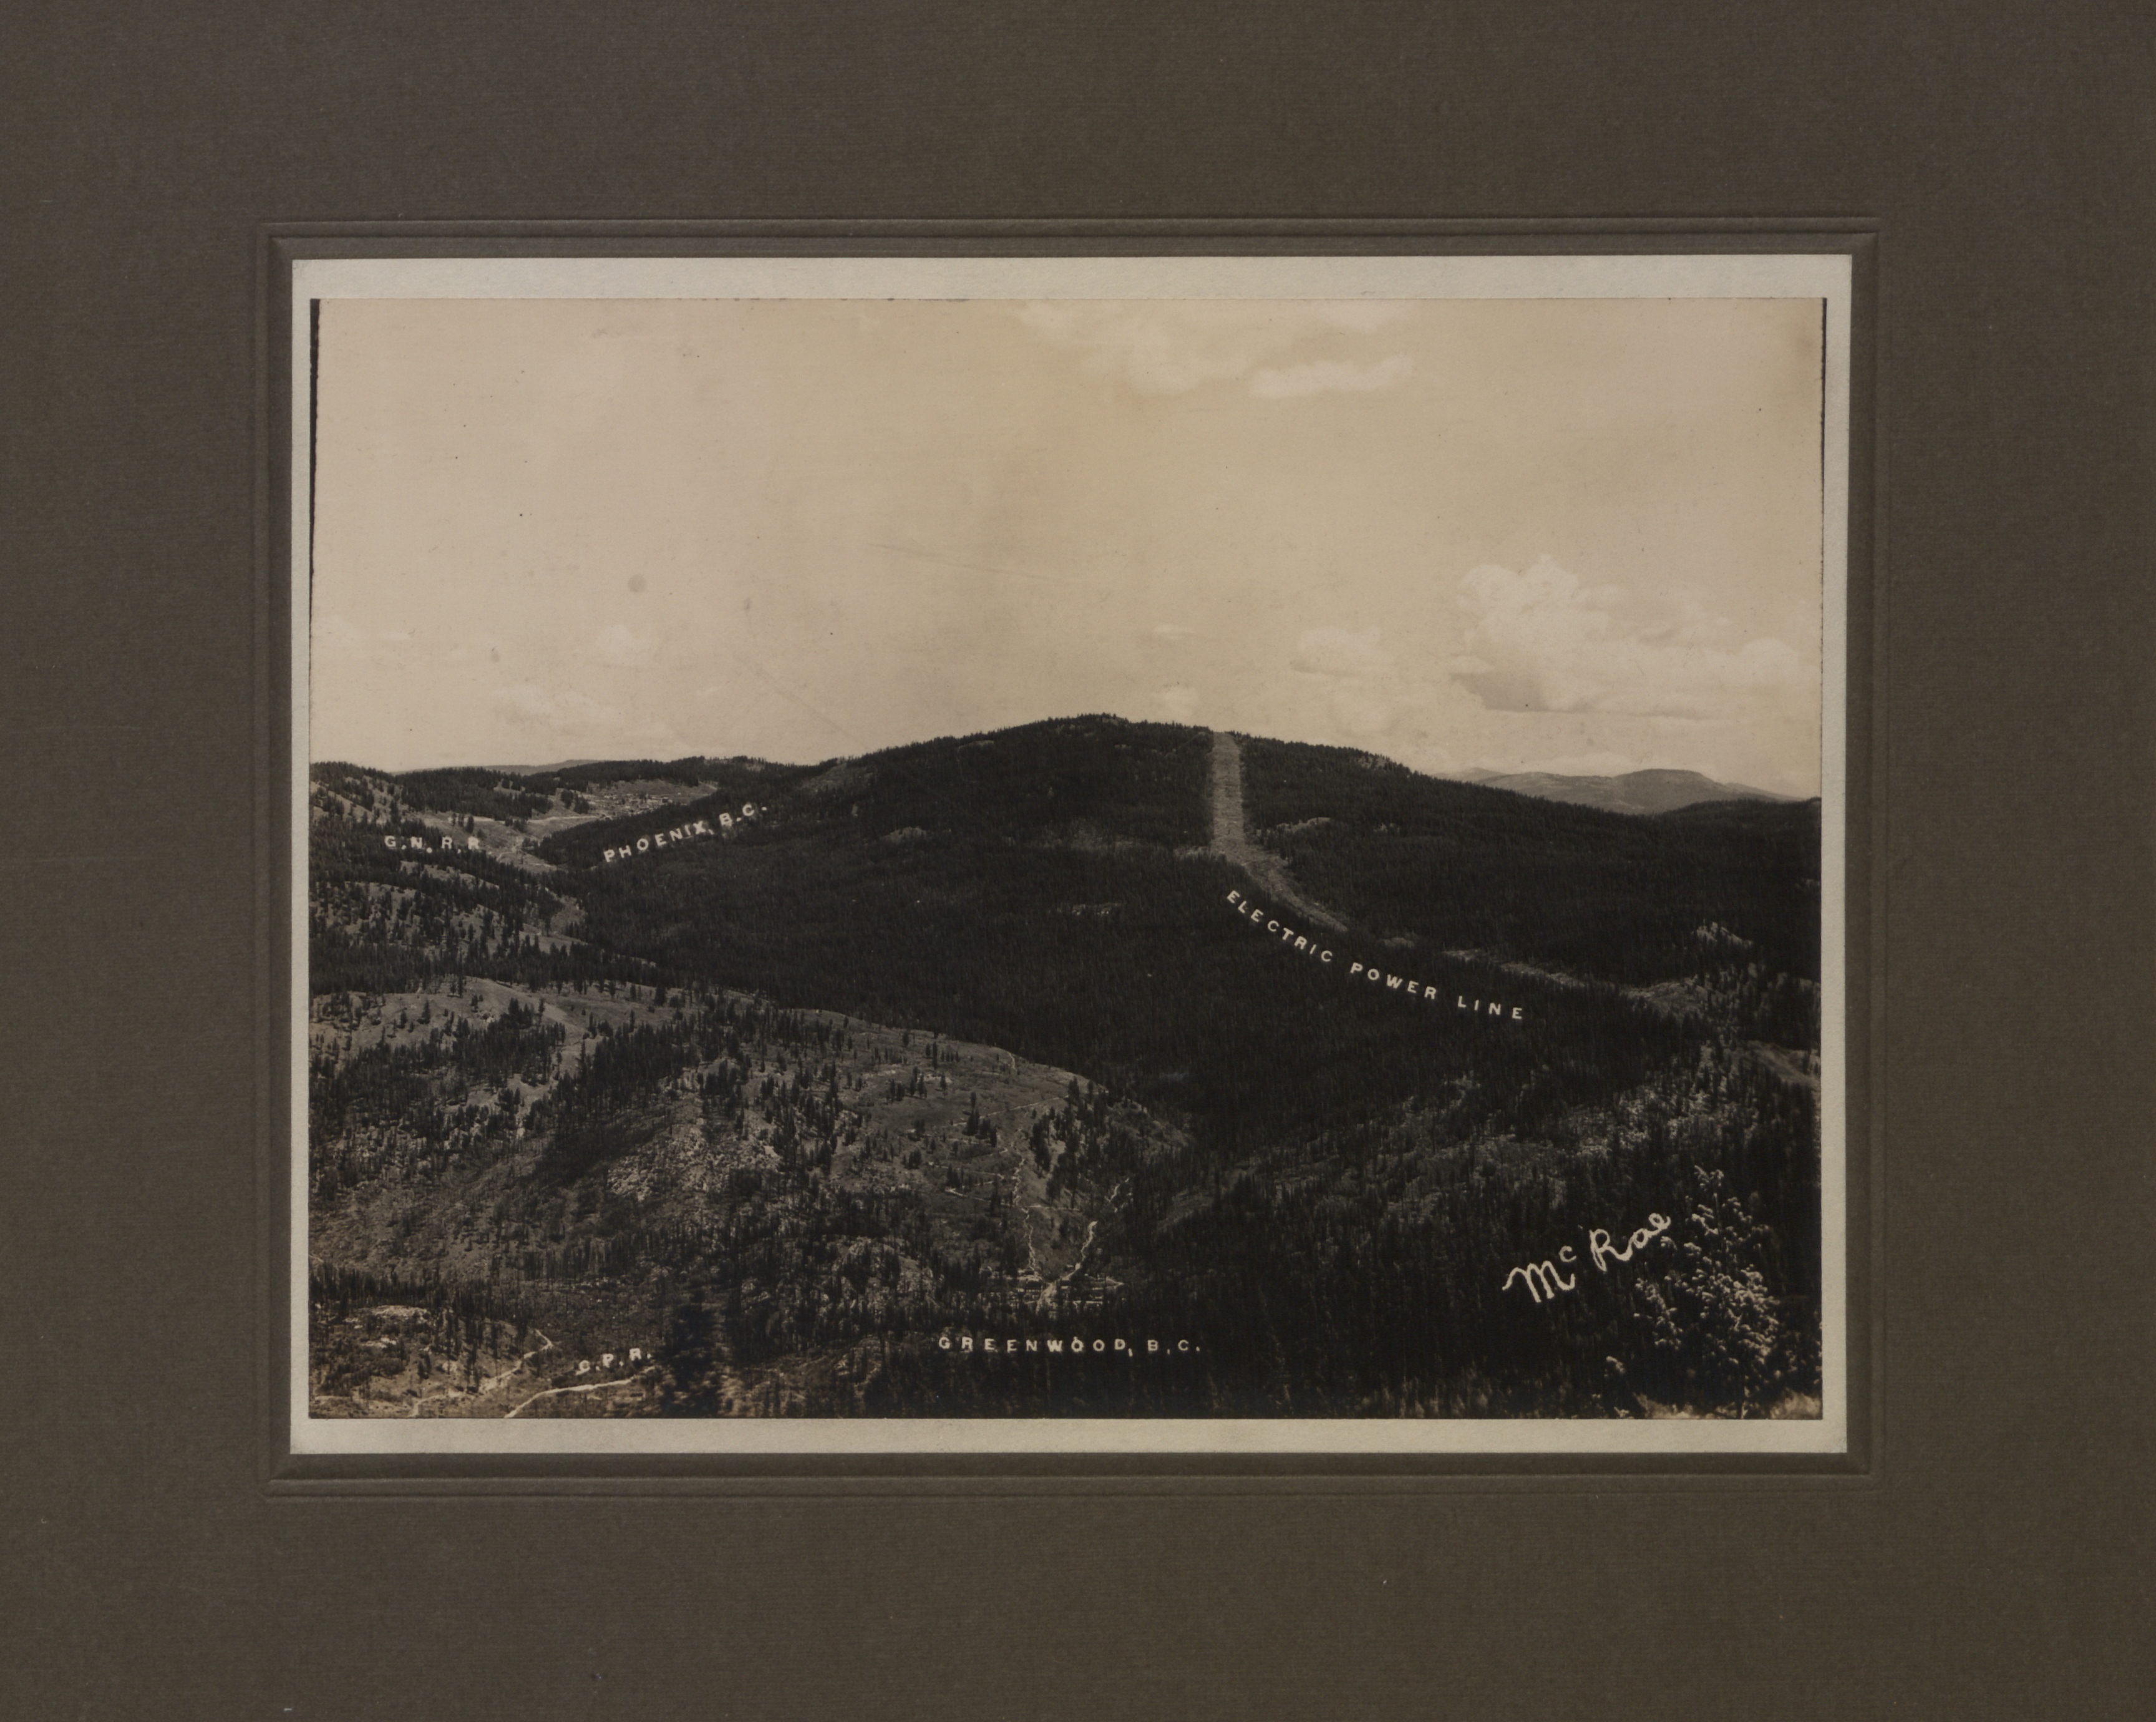
Artist Duncan C. McRae_Greenwood-Phoenix_Date 1906
![Phoenix, B.C. [mining town] Photograph R.H. Trueman & Co. Reference code AM54-S4-: LP 196.4 Name of creator Matthews, James Skitt, Major (1878-1970) Trueman, Richard Henry (Photographer)](https://andrewphillipchernoff.ca/wp-content/uploads/2016/02/ef94489f-7e97-4afc-a7d9-2b77d630f035-a26634.jpg)
Phoenix, B.C. [mining town] Photograph R.H. Trueman & Co. Reference code AM54-S4-: LP 196.4 Name of creator Matthews, James Skitt, Major (1878-1970) Trueman, Richard Henry (Photographer)
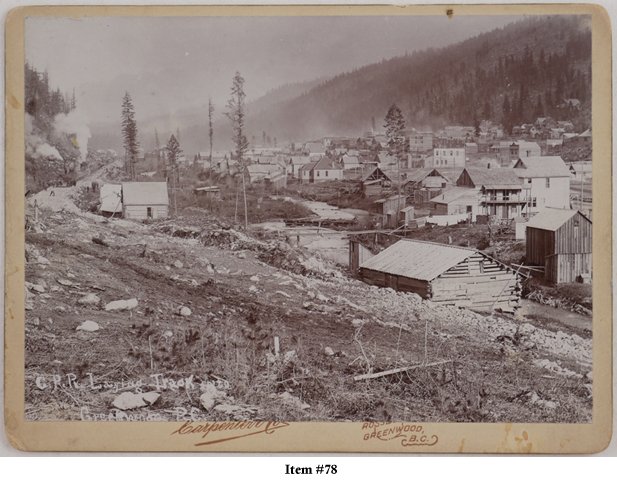
C.P.R. Laying Track into Greenwood, B.C. Ca. early 1900s. “Carpenter & Co. Rossland, Greenwood, B.C.”
![Lower town Phoenix, B.C. Brooklyn Mine [and] Stemwinder Mine Photograph Wm. Hall Level Reference code AM54-S4-: LP 196.3 Date(s) 1901-1902 Name of creator Matthews, James Skitt, Major (1878-1970) Donated by Mr. H.C. Fitz James on Jan. 27, 1953.](https://andrewphillipchernoff.ca/wp-content/uploads/2016/02/phoenix_bc_lowertown.jpg)
Lower town Phoenix, B.C. Brooklyn Mine [and] Stemwinder Mine Photograph Wm. Hall Level Reference code AM54-S4-: LP 196.3 Date(s) 1901-1902 Name of creator Matthews, James Skitt, Major (1878-1970) Donated by Mr. H.C. Fitz James on Jan. 27, 1953.
![Opening of Bank of B.N.A. Reference code AM54-S4-2-: CVA 371-773 Date(s) [ca. 1899]](https://andrewphillipchernoff.ca/wp-content/uploads/2016/02/fe29cea6-fccf-44c1-983a-603971699c53-a61041.jpg)
Opening of Bank of B.N.A. Reference code AM54-S4-2-: CVA 371-773 Date(s) [ca. 1899] Group portrait showing Fisher, Goudel, Martin, Leamy, Oliver, Godfrey, Beilenberg, Ferguson, Coulson, Morris, Ross, Scott, Leckie, Johnson, Walsh, Robbins Barker and others. City of Vancouver Archives.
MONTREAL, February 22, 2016 – As the Trudeau government prepares for its early March First Ministers Meetings on climate change, researchers from the University of Montreal, University of California Santa Barbara, Utah State University and Yale University have just released a new interactive tool to visualize, with unprecedented detail, the geographic distribution of climate opinions across Canada. It allows users to download the underlying estimates of public opinion for each province and riding in Canada. This new tool, presented in the form of maps, is available in English and in French.
The Canadian Climate Opinion Maps (CCOM) was created using a statistical model based on over 5,000 responses to national surveys from 2011-2015. It reveals that, nationally, 79% of Canadians believe that Earth is getting warmer, but the new public opinion maps show distinct differences among provinces and ridings. Moreover, about 67% of adults believe the Earth is warming in Alberta, for example, whereas 85% believe this in Quebec. Within federal electoral districts, percentages vary from 56% in the Souris-Moose Mountain riding in Saskatchewan, to 91% in the riding of Halifax, Nova Scotia.
“Our research shows that across the country, a majority of Canadians are aware of the problem of rising global temperature on Earth, and many believe humans are directly contributing to this warming. This is true across Canadian regions and across the urban-rural divide as well”, said one of the project’s lead researchers, University of Montreal Professor Erick Lachapelle.
In terms of possible solutions for fighting climate change, the idea of implementing an emissions trading system enjoys popular support (66%) across the country. Meanwhile, a carbon tax is less popular nationally (49%), with support for more carbon taxes also being much more variable across ridings.
“Given the importance of public beliefs and perceptions about climate change for mitigation and adaptation planning, we wanted to provide this tool to the public to help foster awareness and dialogue on this crucial issue,” explained University of California Santa Barbara Assistant Professor and lead author Matto Mildenberger. “Hopefully, this strong public support will be reflected in ambitious decision making in the coming months,” he said.
“Thanks to this tool, we are able for the first time in Canada to visualize the geographic diversity of opinions across this vast country, at an unprecedented level of granularity,” added Lachapelle. “We always knew opinions varied across Canadian provinces. Now we see that urban-rural differences are just as important, if not more important, features of Canadian public opinion on climate change” he said
“Of course, opinions and policy preferences are not uniform across the country. So this tool illustrates not only where climate policy support is concentrated, but perhaps more importantly, it depicts where enhanced outreach and engagement efforts are required to bring the public on side with what needs to happen” concluded Lachapelle.
Though high-resolution data sets for climate change risks are readily available, data on public opinion at the local level is almost non-existent. This new data set allows novel insight into public perceptions at scales much closer to where actual decisions, outreach and planning take place. This will be an important resource for decision-makers, planners, practitioners, academics, and engaged citizens.
About the tool:
Users can explore the maps and data by clicking on your province or riding, and compare results across questions and with other geographic areas. They should keep in mind that the uncertainty of the estimates increase as they refine their search to closer geographic scales.
All estimates are derived from a geographic and statistical model validated in the United States and applied to national survey data collected in Canada since 2011 (>5000 survey responses). These data were used to estimate differences in opinion between geographic and demographic groups based on data from Statistics Canada. The results account for change over time. The result is a high-resolution data set of estimated opinion at the national, provincial and riding scales for the year 2015. The accuracy of the estimates are approximately +/- 6 percentage points for provincial-level estimates and +/- 7 percentage points for estimates at the riding level (at a 95% level of confidence).
Source: What do Canadians in every riding believe about climate change? | Science Codex

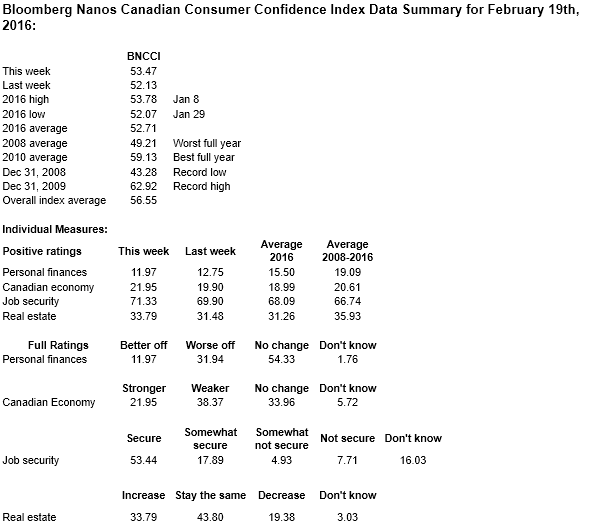
Bloomberg Nanos Weekly Consumer Confidence Tracking
Tracking of consumer sentiment in the Bloomberg Nanos Canadian Confidence Index suggests that a three month slide has halted for the most recent week of tracking.
“Although still hovering near their 12 month low, consumer confidence in both the Prairies and Ontario increased this week,” said Nanos Research Group Chairman Nik Nanos. “This will have to be monitored to see if a new trend emerges with the successive weeks of tracking.”
“Consumer sentiment has been anticipating the decline in economic activity over the past 18 months, which makes this latest uptick noteworthy. Still, the low level of household expectations coincides with the median assessment of professional economists who are calling for the economy to grow by only 1.6 percent in 2016, with a 35 percent probability of a Canadian recession in the next year”, said Robert Lawrie of Bloomberg Economics.
The BNCCI, a composite of a weekly measure of financial health and economic expectations, registered at 53.47 compared with last week’s 52.13. The twelve month high stands at 58.62. The Bloomberg Nanos Pocketbook Index is based on survey responses to questions on personal finances and job security. This sub-indice was at 57.45 this week compared to 57.47 the previous week. The Bloomberg Nanos Expectations Index, based on surveys for the outlook for the economy and real estate prices, was at 49.50 this week (compared to 46.80 last week).
The average for the BNCCI since 2008 has been 56.55 with a low of 43.28 in December 2008 and a high of 62.92 in December 2009. The index has averaged 52.71 this year.
To view the weekly tracking visit our website.
Methodology
The BNCCI is produced by the Nanos Research Corporation, headquartered in Canada, which operates in Canada and the United States. The data is based on random telephone interviews with 1,000 Canadian consumers (land- and cell-lines), using a four week rolling average of 250 respondents each week, 18 years of age and over. The random sample of 1,000 respondents may be weighted by age and gender using the latest census information for Canada and the sample is geographically stratified to be representative of Canada. The interviews are compiled into a four week rolling average of 1,000 interviews where each week, the oldest group of 250 interviews is dropped and a new group of 250 interviews is added. The views of 1,000 respondents are compiled into a diffusion index from 0 to 100. A score of 50 on the diffusion index indicates that positive and negative views are a wash while scores above 50 suggest net positive views, while those below 50 suggest net negative views in terms of the economic mood of Canadians.
A random telephone survey of 1,000 consumers in Canada is accurate 3.1 percentage points, plus or minus, 19 times out of 20.
All references or use of this data must cite Bloomberg Nanos as the source.