Canada’s Greenhouse Gas Emissions: Developments, Prospects and Reductions

Get the report
Canada’s Greenhouse Gas Emissions: Developments, Prospects and Reductions.PDF

Get the data
GHG Data.xlsx
Interactive Chart
Summary
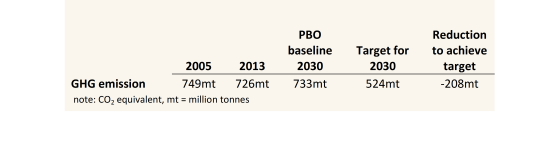
Canada has adopted a target for greenhouse gas (GHG) emissions in 2030 of 30 per cent below the level of 2005. To achieve that, significant changes will have to occur to make the economy less GHG-intensive. The federal government has adopted measures to reduce emissions in electricity generation and transport. As well, a number of provincial governments such as Alberta, British Columbia, Quebec and Manitoba, have put in place moderate measures to limit emissions, while others have announced programs. Those measures, while substantial, are unlikely to achieve the target on their own. Deeper reductions will be needed.

The technologies to achieve the target are mostly ready, so the impact will likely not significantly alter Canadian lifestyles. Indeed, with some technologies, fossil-fuels will continue to be used, but their emissions will be curtailed.

The needed changes will, however, necessarily impact on the economy since non-GHG sources of energy are currently more costly than cheap coal, natural gas or even oil products. The estimate used in the PBO report indicates that incomes could be reduced by between 1 and 3 per cent, relative to where PBO projects they would otherwise be.

These estimates are averages for all sectors and regions. The outcomes for individual sectors and regions will be highly diverse since there is considerable variation in current sources of emissions.

This also highlights that there are significant risks in a large-scale move to lower emissions. Two aspects where the risk is manifest are: (1) a patchwork of abatement programs across different sectors and regions may lead to unnecessarily high costs; and (2) regional disparity in impacts which could affect a pan-Canadian effort. Moreover, existing measures such as the coal regulation and future auto-efficiency improvements have implicit carbon-prices associated with them; introducing new measures such as carbon taxes without properly accounting for them will increase overall costs since sectors affected by those regulations will have compounded costs.

Source: Canada’s Greenhouse Gas Emissions: Developments, Prospects and Reductions

Consumer confidence in Canada shows positive pressure (released May 1, 2016)

Bloomberg-Nanos Economic Banner

Bloomberg Nanos Weekly Consumer Confidence Tracking

The Bloomberg Nanos Canadian Confidence Index showed positive pressure overall on each of the four sub-components in the past week.

“All indicators showed a positive direction and this was especially the case for perceptions on job security.,” said Nanos Research Group Chairman Nik Nanos.

“The upturn in consumer sentiment coincides with a robust first quarter. This level of growth will likely be short-lived, however, considering the effects of lower commodity prices, the loss of traditional manufacturing, and the recent appreciation of the Canadian loonie against the U.S. greenback”, said Bloomberg economist Robert Lawrie.

The BNCCI, a composite of a weekly measure of financial health and economic expectations, registered at 56.92 compared with last week’s 55.87. The twelve month high stands at 58.62.

The Bloomberg Nanos Pocketbook Index is based on survey responses to questions on personal finances and job security. This sub-indice was at 58.89 this week compared to 57.89 the previous week. The Bloomberg Nanos Expectations Index, based on surveys for the outlook for the economy and real estate prices, was at 54.96 this week (compared to 53.84 last week).

The average for the BNCCI since 2008 has been 56.45 with a low of 43.28 in December 2008 and a high of 62.92 in December 2009. The index has averaged 53.92 this year.

To view the weekly tracking visit our website.

Methodology

The BNCCI is produced by the Nanos Research Corporation, headquartered in Canada,  which operates in Canada and the United States.  The data is based on random telephone interviews with 1,000 Canadian consumers (land- and cell-lines), using a four week rolling average of 250 respondents each week, 18 years of age and over. The random sample of 1,000 respondents may be weighted by age and gender using the latest census information for Canada and the sample is geographically stratified to be representative of Canada. The interviews are compiled into a four week rolling average of 1,000 interviews where each week, the oldest group of 250 interviews is dropped and a new group of 250 interviews is added. The views of 1,000 respondents are compiled into a diffusion index from 0 to 100. A score of 50 on the diffusion index indicates that positive and negative views are a wash while scores above 50 suggest net positive views, while those below 50 suggest net negative views in terms of the economic mood of Canadians.

A random telephone survey of 1,000 consumers in Canada is accurate 3.1 percentage points, plus or minus, 19 times out of 20.

All references or use of this data must cite Bloomberg Nanos as the source.

screenshot-{domain} {date} {time}

Researchers Create Detailed ‘Semantic Atlas’ of the Mind 

Scientists at the University of California, Berkeley, build a semantic atlas to chart how the brain responds to language. Image credit: University of California, Berkeley.

A team of neuroscientists and psychologists at the University of California, Berkeley, has created a detailed ‘semantic atlas’ showing which human brain areas respond to hearing different words. The results were published this week in the journal Nature.

“Our goal in this study was to map how the brain represents the meaning (or semantic content) of language,” explained lead author Alexander Huth, from the University of California’s Helen Wills Neuroscience Institute. “Most earlier studies of language in the brain have used isolated words or sentences.”

“We used natural, narrative story stimuli because we wanted to map the full range of semantic concepts in a single study. This made it possible for us to construct a semantic map for each individual, which shows which brain areas respond to words with similar meaning or semantic content.”

“Another aim of this study was to create a semantic atlas by combining data from multiple subjects, showing which brain areas represented similar information across subjects.”

Huth and six other native English-speakers served as subjects for the experiment.

They listened passively to several stories selected from The Moth Radio Hourwhile brain activity was monitored using functional magnetic resonance imaging (fMRI). The stories were then transcribed and annotated with the time each word was spoken.

Then the scientists used the fMRI data and story transcripts to build computational models that predict brain activity as a function of which words the subject heard. To validate these models, they were used to predict fMRI responses to a new story that had not been used before.

“We found that the models were able to predict responses relatively well throughout several broad regions of the cerebral cortex,” Huth said.

“Next, we aimed to discover what types of semantic information were represented at each point in cortex. In order to visualize the very high-dimensional semantic models, we used a dimensionality reduction technique called principal components analysis (PCA).”

PCA finds the most important dimensions in a dataset, which allowed the team to reduce the 985-dimensional models to only three dimensions, while preserving as much information as possible.

“We used these three dimensions to visualize roughly which types of semantic information were represented at every location in the cortex, revealing complex semantic maps that tile the brain,” Huth said.

“Finally, to discover which aspects of these maps are shared across subjects we developed and applied a new computational approach called PrAGMATiC. This approach finds functional areas that are shared across subjects, while also allowing for individual variability in the anatomical location of each area.”

According to Huth and co-authors, detailed maps showing how the brain organizes different words by their meanings could eventually help give voice to those who cannot speak, such as victims of stroke or brain damage, or motor neuron diseases such as ALS.

“While mind-reading technology remains far off on the horizon, charting how language is organized in the brain brings the decoding of inner dialogue a step closer to reality,” they said.

For example, clinicians could track the brain activity of patients who have difficulty communicating and then match that data to semantic language maps to determine what their patients are trying to express.

Another potential application is a decoder that translates what you say into another language as you speak.

_____

Alexander G. Huth et al. 2016. Natural speech reveals the semantic maps that tile human cerebral cortex. Nature 532, 453-458; doi: 10.1038/nature17637

Source: Researchers Create Detailed ‘Semantic Atlas’ of the Mind | Neuroscience | Sci-News.com

One in six children hospitalized for lung inflammation positive for marijuana exposure 

BALTIMORE, MD – A new study to be presented at the Pediatric Academic Societies 2016 Meeting found that one in six infants and toddlers admitted to a Colorado hospital with coughing, wheezing and other symptoms of bronchiolitis tested positive for marijuana exposure.

The study, “Marijuana Exposure in Children Hospitalized for Bronchiolitis,” recruited parents of previously healthy children between one month of age and two years old who were admitted to Children’s Hospital Colorado (CHC) between January 2013 and April 2014 with bronchiolitis, an inflammation of the smallest air passages in the lung. The parents completed a questionnaire about their child’s health, demographics, exposure to tobacco smoke, and as of October 2014, whether anyone in the home used marijuana. Marijuana became legal in Colorado on January 1, 2014.

Of the children who were identified as having been exposed to marijuana smokers, urine samples showed traces of a metabolite of tetrahydrocannabinol (THC), the psychoactive component of marijuana, in 16 percent of them. The results also showed that more of the children were THC positive after legalization (21 percent, compared with 10 percent before), and non-white children were more likely to be exposed than white children.

The findings suggest that secondhand marijuana smoke, which contains carcinogenic and psychoactive chemicals, may be a rising child health concern as marijuana increasingly becomes legal for medical and recreational use in the United States, said lead researcher Karen M. Wilson, MD, MPH, FAAP, an associate professor of pediatrics at the University of Colorado School of Medicine and section head at CHC. Most states with legal marijuana do not restrict its combustion around children, she said.

“Our study demonstrates that, as with secondhand tobacco smoke, children can be exposed to the chemicals in marijuana when it is smoked by someone nearby,” Dr. Wilson said. “Especially as marijuana becomes more available and acceptable, we need to learn more about how this may affect children’s health and development.” In the meantime, she said, “marijuana should never be smoked in the presence of children.”

Source: American Academy of Pediatrics

Source: One in six children hospitalized for lung inflammation positive for marijuana exposure | Science Codex