Twelvefold increase in Zika cases since Ecuador earthquake

More than 50 families reside in the informal refuge built in La Chorerra community, where no public services are provided and children are at increased risk of diseases such as Zika virus. ©UNICEF/UN025173/Troppoli (CNW Group/UNICEF Canada)

UNICEF and partners are supporting the national government by raising awareness and providing necessary supplies

NEW YORK/PANAMA/QUITO/TORONTO, July 19, 2016 /CNW/ – Three months after the Ecuador earthquake, the number of Zika Virus cases increased from 92 to 1,106 country-wide, with the sharpest increase in the quake-hit areas.

According to national data, 80 per cent of the Zika cases are in the province of Manabí where the April 16 earthquake left most damage. After the earthquake, the proliferation of stagnant waters, and concentration of displaced persons increased the risk of vector transmission.

Women between 15 and 49 years of age are the worst affected by the virus, accounting for 509 cases in Manabí.

While there have been no Zika-related microcephaly cases in newborns so far, 73 confirmed cases of pregnant women with Zika Virus have been reported.

“We need to urgently scale up the Zika preventative interventions to reduce its transmission and impact on children and their families”, said Grant Leaity, UNICEF Representative in Ecuador.

UNICEF is working with the Ministry of Public Health on an awareness campaign, and is also working along with the Ministry of Education in order to produce educational material based on Zika Virus prevention for teachers and students. In addition, impregnated mosquito nets, personal hygiene kits and water tank cleaning supplies will be provided for pregnant women as well as families in the most vulnerable areas.

Throughout the earthquake affected zones, UNICEF has also supported the emergency with the provision of temporary educational spaces for approximately 12,000 children and 590 “School in a Box” kits have been given for teachers and an additional 23,600 students.

Along with humanitarian partners, about 250,000 people have been benefitted through the provision of safe water, sanitation and hygiene encouragement. 350,000 Zinc tablets have also been provided for 12,500 children under 5 years of age, micronutrients for more than 80,000 and over 250,000 Vitamin A doses, in order to prevent malnutrition and associated health issues.

Over 20,000 children have received psychosocial attention through the ¨Return to Happiness¨ methodology.

Download photos and interviews with Zika affected mothers: http://uni.cf/29GhWL7

RELATED LINKS
http://www.unicef.ca

Source: Twelvefold increase in Zika cases since Ecuador earthquake

From The Past: Profile of The Boundary District In 1907

fromthepast

By Andrew Phillip Chernoff

Source: The Greenwood Ledge, Greenwood, B.C., July 18, 1907

cdm.xledgreen.1-0181300.0002

Greenwood Ledge, Greenwood, B.C., July 18, 1907

Fiscal Sustaintability Report 2016 – Clarification and Additional Information

7 July 2016

FSR 2016 – Clarification and Additional Information

In response to the 29 June 2016 commentary “Why Canada’s long-term fiscal prospects are not a hot mess” by A. Yalnizyan (available at:http://behindthenumbers.ca/2016/06/29/why-canadas-long-term-fiscal-prospects-are-not-a-hot-mess/), this blog post provides clarification and additional information related to our 2016 Fiscal Sustainability Report.

Fiscal sustainability

The concept of sustainability in our reports is based on the government’s (infinite horizon) inter-temporal budget constraint. This constraint requires that the present value of future revenues must equal the present value of future program spending and the current level of debt—the government cannot run a Ponzi scheme where the debt ultimately grows faster than the interest rate.

We would argue that this concept is tied to “affordability” in the sense of income = expenditure. Over time, in present value terms, the stream of revenues (income) must cover the future stream of program spending and the interest on the existing debt (expenditure). If the stream of future revenues does not cover the future stream of program spending and interest on the existing debt, then debt will follow an explosive path and so will debt servicing.

However, to put this concept into practice we use a finite horizon (but over a very long timeframe—75 years) budget constraint and therefore need to make an assumption about the level of debt at the end of the horizon. Based on other studies, we chose to use the level of debt that would be consistent with achieving a debt-to-GDP ratio at the end of the horizon equal to the current level. However, we do not indicate that this is the “right” level. Indeed, this is a technical assumption and we should be more careful to describe it as such.

That said, while this might seem like a crucial assumption, given the length of our time horizon, it really isn’t. Table 8-5 in our report shows our fiscal gap estimates assuming an endpoint debt-to-GDP ratio of 100%. Tripling (almost) the federal debt ratio assumption from 33.7% to 100% increases federal fiscal room from 0.9% of GDP in our baseline estimate to 1.7% of GDP. Tripling (almost) the subnational debt ratio from 32.5% to 100% decreases the fiscal gap from 1.5% of GDP to 1.0% of GDP. Under the alternative debt ratio endpoint assumptions, it is still the case that the federal (subnational) fiscal structure is sustainable (unsustainable). As the commentary rightly notes, this is all about the trajectory of the debt-to-GDP ratio—sustainability simply means that the debt ratio can’t explode over the long term.

Subnational government health spending

The commentary’s description of the approach we take to project subnational health spending is not correct. Note 9 in our report provides a brief description but it probably isn’t sufficiently clear (previous reports provided more detail). Essentially, there are 3 main drivers in our projection of health spending:  nominal GDP; “ageing”; and excess cost. We assume that there is a 1:1 relationship between growth in health spending and growth nominal GDP. The ageing component of our projection weights per capita health spending by age group (in 2013) by projected age group shares in the population. So, the first 2 drivers are indeed “forward-looking” and not based on growth rates over the past 30 years.

The excess cost component in our projection is, however, based on the average growth observed over 1982-2015. Over the historical period, excess cost is calculated residually—the growth in health care spending that exceeds growth in nominal GDP and “ageing”. In our baseline projection, we do assume that growth in excess cost will be the same as it was, on average, over 1982-2015. Our estimates suggest that there is some mean-reversion in excess cost growth. While excess cost growth has been negative since 2010, it appears to be edging higher, returning to our assumed level (Figure 1). (N.B. The commentary notes that since 2012, “things seem to be changing” with respect to trends in health care spending. While growth in health spending, based on CIHI data, decelerated in 2012 and 2013, CIHI numbers for 2014 and 2015 are CIHI forecasts (which we believe are based on governments’ main estimates/appropriations.)

Figure 1:  Excess cost growth in subnational government health spending, 1982-2015 (%)

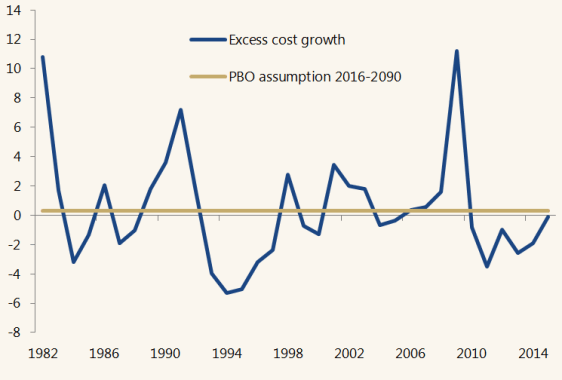
Sources:  Canadian Institute for Health Information; Statistics Canada; and Parliamentary Budget Officer.

Like everyone else, we don’t know what excess cost growth will be over the next 30 years. Mean reversion for excess cost growth seems reasonable to us for a baseline. We do consider an alternative scenario in which excess cost growth is zero (Table 8-4), however, this does not change our conclusion about the (un)sustainability of the subnational sector.

Immigration

By construction, population growth feeds into both our revenue and spending projections.

Over the projection, our assumption about the immigration rate is taken from Statistics Canada’s medium population projection (http://www.statcan.gc.ca/pub/91-620-x/91-620-x2014001-eng.pdf) and is not simply the average observed over the past 30 years. Indeed, our assumption is very close to recent immigration rates (Figure 2).

Figure 2:  Immigration rate, 1971-2014

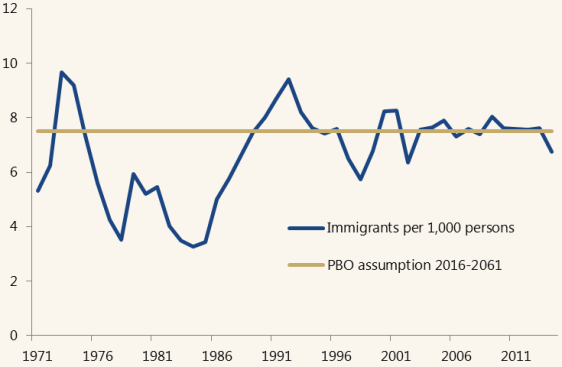
Sources:  Statistics Canada and Parliamentary Budget Officer.

Moreover, in our sensitivity analysis, we do consider a younger or “lower cost” population projection where the immigration rate is 9 immigrants per 1,000 persons (compared to 7.5 in our baseline). Under the lower cost population scenario, federal fiscal room increases from 0.9% to 1.3% of GDP and the subnational fiscal gap falls from 1.5% to 1.1% of gap (Table 8-1). However, our conclusion about federal and subnational sustainability is not changed under this alternative scenario.

Related posts

  • 28 June 2016

    This report extends PBO’s medium-term analysis to assess the fiscal sustainability of Canada’s federal government, subnational governments and public pension plans.

Source: Fiscal Sustaintability Report 2016 – Clarification and Additional Information

Canucks Sign Forward Michael Carcone To A Three-Year Entry Level Contract

VancouverCanucksCANUCKS BANTER     By Andrew Chernoff    July 15, 2016

IMG_8907-e1456496536747

Vancouver Canucks General Manager Jim Benning announced July 15 that the club signed forward Michael Carcone to a three-year entry level contract, according to a press release.

Carone will receive:

  • a pay out in 2016-17 of $625,000 at the NHL level and $50,000 at the AHL level, with a $25,000 signing bonus
  • in 2017-18, he will receive $675,000 at the NHL level and $55,000 at the AHL level, with a $25,000 signing bonus
  • and in his final year in 2018-19, $725,000 at the NHL level and $60,000 at the AHL level, with a $25,000 signing bonus, according to generalfanager.com

Carcone, 20, appeared in 66 games for the Drummondville Voltigeurs of the QMJHL in 2015.16, where he ranked tied for the team lead in points (89) and finished first in goals (47) and second in assists (42).

His goal total on the year ranked tied for second among all QMJHL skaters while his 16 power play goals ranked third in the league and he was eighth in the QMJHL in total points.

The 5-10, 170-pound forward has appeared in 116 regular season games over two seasons for Drummondville, registering 130 points (59-71-130) and 112 penalty minutes.

Prior to joining the Voltigeurs, the Ajax, Ontario native spent the 2013.14 season with the OJHL Stouffville Spirit, where he led the club in scoring during the regular season notching 37 points (12-25-37) in 49 games.

Back on July 10, Daniel Wagner of the Vancouver Courier wrote that the Canucks may have signed Carone after Carcone stood out at the recent Canucks development camp. Wagner wrote:

One of the most intriguing names invited to the Canucks prospect development camp was Michael Carcone, who was one of the most dangerous goalscorers in the QMJHL last season. Carcone evidently made an impression at camp, as he has reportedly signed a three-year, entry-level contract with the Canucks.

This is according to J.D. Burke of Canucks Army, who apparently has sources now, which makes sense when you consider how many former Canucks Army writers now work in the NHL.

Carcone made an impact in the public scrimmage at the end of camp, showcasing his silky hands and finish around the net, scoring one goal. You can see him in the highlights from the scrimmage the Canucks posted on YouTube:

Carcone makes his first appearance at 1:22, skating through the neutral zone, then burning Lukas Jasek on the outside before evading Troy Stecher’s pokecheck and tucking the puck around goaltender invitee Rylan Parenteau. It’s a lovely goal and it wasn’t his only standout moment

He shows up again at 1:53, skating in alone on Parenteau, neatly deking past the pokecheck and forcing a nice save. He then takes a pass from fellow invitee Kyle Maksimovich, deftly chips the puck over Brock Boeser’s stick in the high slot, and forces another great save from Parenteau, who snags it with his glove.

Canucks GM Benning Seeking Left Winger By Hockey Trade, Won’t Trade Hansen

VancouverCanucksCANUCKS BANTER     By Andrew Chernoff    July 14, 2016

jim_benning

In an article in the Province by Ben Kuzma today, Vancouver Canucks GM Jim confirmed he is seeking a second-line left winger

“We’ve been talking to some teams and it would be a hockey trade,” summed up Benning. “The first part of free agency was guys signing and the second layer is going to be teams wanting to move contracts or bodies. Teams know what we’re looking for and we’ll see how it goes.”

Benning also told Kuzma, that Jannik Hansen, who was not shopped at the trade deadline or the draft, is not available for trade.

“We’re not moving Jannik,” he stressed. “I thought he was excellent for us last year and with the way the game is going with speed and skill, he fits that description perfectly. And we have him under a good (cap) number the next couple of years, so we’re not looking to do anything.”