Foreign buyers will not need to pay the new 15 per cent tax on pre-sale condos, according to NDP MLA David Eby.
via Foreign buyer tax will not apply to purchases of pre-sale condos —

Foreign buyers will not need to pay the new 15 per cent tax on pre-sale condos, according to NDP MLA David Eby.
via Foreign buyer tax will not apply to purchases of pre-sale condos —
 CANUCKS BANTER By Andrew Chernoff July 26, 2016
Source: http://canucks.nhl.com

By Carol Linnitt • Monday, July 18, 2016
The Site C dam, advanced as the province’s showcase clean energy project by the B.C. government, according to a new report from the University of British Columbia.
Authored by Rick Hendriks from Camerado Energy Consulting, the report found Site C, a BC Hydro megadam proposed for the Peace River near Fort St. John, will not provide energy at a lower greenhouse gas (GHG) emission rate than other alternative energy projects.
“The government stated that the unprecedented level of significant adverse environmental effects from Site C are justifiable, in part, because the project delivers energy and capacity at lower GHG emissions than the available alternatives,” Hendriks, an energy consultant with more than 20 years experience analyzing large-scale hydropower projects, said.
“Our analysis indicates this is not the case.”
Comparing BC Hydro’s own data on Site C and alternative energy scenarios, the report found the megadam provides no substantial benefit over other renewable sources like wind and solar.
“I feel like the discussion in the public has made a few assumptions about the Site C dam that merit reexamination,” Karen Bakker, professor of geography at UBC and Canada Research Chair in Political Ecology, told DeSmog Canada.
Bakker, who oversaw the new greenhouse gas analysis, is one of several scholars who recently found the Site C project represents the largest amount of significant adverse environmental impacts ever reviewed under the Canadian Environmental Assessment Act since its introduction into law.
She said although the joint federal-provincial review panel tasked with considering the Site C project did some good work, they were limited in resources and scope when it came to a fulsome project analysis. The panel did not consider the greenhouse gas emissions associated with the project.
That’s the simple way to sum up why we’re doing what we’re doing,” she said.
Bakker said the report did not conduct an independent review of BC Hydro’s own greenhouse gas estimates for the project, but said, “even using their own numbers Site C is not cleaner or greener than other renewables.”
“Our analysis suggests that other renewables like wind and solar would help Canada achieve its climate change goals more quickly and cheaply and with much lower environmental impact than Site C.”
Bakker said the new report highlights the need for more thorough analysis of Site C’s environmental impacts. She added more research, which doesn’t rely on BC Hydro’s estimates, needs to be conducted.
“There’s much more to be done,” she said. “It would be great if this had been studied and geothermal had been examined as well.”
The Site C dam will power a proposed 1100-megawatt electricity facility, producing far more electricity than B.C. is projected to need for roughly two decades.
Local farmers, landowners and First Nations say the dam, which will flood 107 kilometres of the Peace River valley, will unnecessarily destroy wildlife habitat, First Nations archaeological and hunting sites and some of the province’s most productive agricultural land.
The chair of the Site C Joint Review Panel, Harry Swain, has come out against the project, saying B.C.’s domestic electricity demand has not significantly increased since 2007, meaning the province has no need for the estimated $9-billion project.
“I think we’re making a big mistake, a very expensive one,” Swain recently told DeSmog Canada. “Of the $9 billion it will cost, at least $7 billion will never be returned. You and I as rate payers will end up paying $7 billion bucks for something we get nothing for.”
“There is no need for Site C,” Swain said. “If there was a need, we could meet it with a variety of other renewable and smaller scale sources.”
Source: Site C Project Far From Clean and Green, Finds New UBC Report | DeSmog Canada

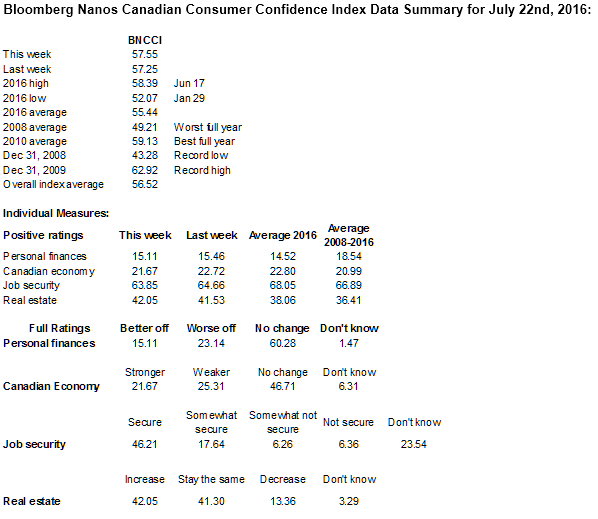
Bloomberg Nanos Weekly Consumer Confidence Tracking
The week over week Bloomberg Nanos Canadian Confidence Index remained steady. However, confidence in the future strength of the Canadian economy cycled to a three month low
“Only 21.7 per cent of Canadians believe the Canadian economy will get stronger compared to 25.3 per cent who believe it will get weaker resulting in continued net negative sentiment on this forward looking measure,” said Nanos Research Group Chairman Nik Nanos.
“Canada’s economic growth is anticipated to be a subpar 1.4% this year and 2.1% in 2017, according to the IMF. That would be just about average among the developed economies, but moderate nonetheless and against a backdrop of global uncertainty. More to the point for consumers, a recent Bank of Canada paper confirms an overall lack of wage pressure since 2015 and decreases in manufacturing wages specifically. There are some positive signs, however, including increases in service-sector wages and steps toward an entrepreneurship economy that might take time to filter through to household confidence”, said Bloomberg economist Robert Lawrie.
The BNCCI, a composite of a weekly measure of financial health and economic expectations, registered at 57.55 compared with last week’s 57.25. The twelve month high stands at 58.62.
The Bloomberg Nanos Pocketbook Index is based on survey responses to questions on personal finances and job security. This sub-indice was at 58.83 this week compared to 58.48 the previous week. The Bloomberg Nanos Expectations Index, based on surveys for the outlook for the economy and real estate prices, was at 56.26 this week (compared to 56.02 last week).
The average for the BNCCI since 2008 has been 56.52 with a low of 43.28 in December 2008 and a high of 62.92 in December 2009. The index has averaged 55.44 this year.
To view the weekly tracking visit our website.
Methodology
The BNCCI is produced by the Nanos Research Corporation, headquartered in Canada, which operates in Canada and the United States. The data is based on random telephone interviews with 1,000 Canadian consumers (land- and cell-lines), using a four week rolling average of 250 respondents each week, 18 years of age and over.
The random sample of 1,000 respondents may be weighted by age and gender using the latest census information for Canada and the sample is geographically stratified to be representative of Canada. The interviews are compiled into a four week rolling average of 1,000 interviews where each week, the oldest group of 250 interviews is dropped and a new group of 250 interviews is added.
The views of 1,000 respondents are compiled into a diffusion index from 0 to 100. A score of 50 on the diffusion index indicates that positive and negative views are a wash while scores above 50 suggest net positive views, while those below 50 suggest net negative views in terms of the economic mood of Canadians.
A random telephone survey of 1,000 consumers in Canada is accurate 3.1 percentage points, plus or minus, 19 times out of 20.
All references or use of this data must cite Bloomberg Nanos as the source.

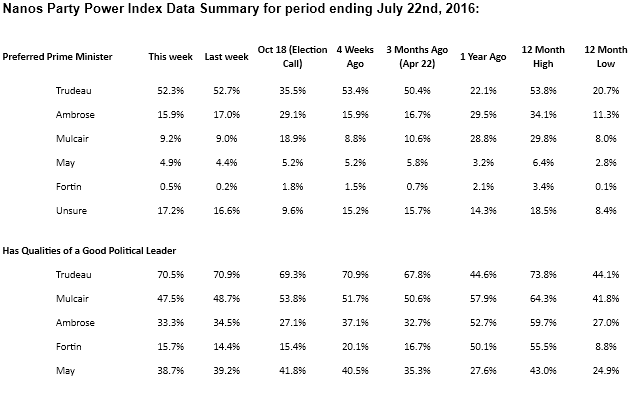
Nanos Weekly Leadership Tracking
The team at Nanos in conjunction with Klipfolio have launched our new live political data portal where you run the numbers you want and can explore the trends and data you need. This is part of our campaign, not only to provide the most reliable data to Canadians but to let them use it as they wish. We were the first to do nightly tracking and now we are the first research organization to post live public opinion data for Canadians.
We were the first to do nightly tracking and now we are the first research organization to post live public opinion data for Canadians.
Here’s the link to check it out.
To view the detailed tracking visit our website.
Methodology
The views of 1,000 respondents are compiled into a party power brand index for each party that goes from 0 to 100, where 0 means that the party has no brand power and 100 means it has maximum brand power. A score above 50 is an indication of brand power for the party and its leader at this time.
The important factors in this weekly tracking include the direction of the brand strength or weakness and also the brand power of one federal party relative to another.
The data is based on random telephone interviews with 1,000 Canadians, using a four week rolling average of 250 respondents each week, 18 years of age and over. The random sample of 1,000 respondents may be weighted by age and gender using the latest census information for Canada, and the sample is geographically stratified to be representative of Canada
The interviews are compiled into a four week rolling average of 1,000 interviews where each week, the oldest group of 250 interviews is dropped and a new group of 250 interviews is added. The current wave of tracking is based on a four-week rolling average of 1,000 Canadians (250 per week) ending July 22nd, 2016.
A random telephone survey of 1,000 Canadians is accurate 3.1 percentage points, plus or minus, 19 times out of 20.
All references or use of this data must cite “Nanos Party Power Index” as the source.