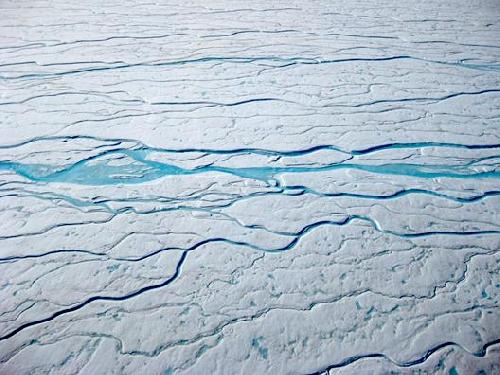
TORONTO, January 4, 2016 – The Greenland ice sheet has traditionally been pictured as a bit of a sponge for glacier meltwater, but new research has found it is rapidly losing the ability to buffer its contribution to rising sea levels, says a York University researcher.
York U Professor William Colgan, a co-author on the study published today in the journal Nature Climate Change, helped analyse data from three expeditions to the Greenland ice sheet in 2012, 2013 and 2015. The research was done in conjunction with lead researcher Horst Machguth of the Geological Survey of Denmark and Greenland, Mike MacFerrin of the University of Colorado at Boulder and Dirk van As of the Geological Survey of Denmark and Greenland Copenhagen, Denmark.
Colgan spent five weeks with the team in 2013 drilling firn cores in the interior of the Greenland ice sheet. Firn is multi-year compacted snow that is not as dense as glacier ice. Instead, it forms a porous near-surface layer over the ice sheet. Dropped off by a ski-equipped US Air National Guard C-130 Hercules in minus 40 degrees Celsius weather, with 6,000 kilos of supplies and equipment, the team set up several camps and drilled a series of shallow firn cores about 20 metres deep during their time on the ice sheet.
“We were interested in the thin porous near-surface firn layer, and how its physical structure is changing rapidly with climate change,” said Colgan of the Lassonde School of Engineering. “The study looked at very recent climate change on the ice sheet, how the last couple of years of melt have really altered the structure of the ice sheet firn and made it behave differently to future melt.”
The researchers also towed a radar unit behind their skidoos to gather profiles between core sites along a 100-kilometre path from the low elevation ice sheet margin into the high elevation ice sheet interior. They analysed the firn cores on the spot by cutting them into small sections to quantify their properties, such as their density, so they could compare them with samples collected the following year. “The year-on-year firn changes were quite dramatic,” said Colgan.
The team was surprised by what they found. An extreme melt that occurred in 2012 caused a layer of solid ice, several metres thick, to form on top of the porous firn in the low elevation areas of the ice sheet. “In subsequent years, meltwater couldn’t penetrate vertically through the solid ice layer, and instead drained along the ice sheet surface toward the ocean,” said Colgan. “It overturned the idea that firn can behave as a nearly bottomless sponge to absorb meltwater. Instead, we found that the meltwater storage capacity of the firn could be capped off relatively quickly.”
As Machguth said, “Basically our research shows that the firn reacts fast to a changing climate. Its ability to limit mass loss of the ice sheet by retaining meltwater could be smaller than previously assumed.”
Because the models scientists use to project Greenland’s sea level rise contribution do not presently take firn cap-off into consideration, it means that Greenland’s projected sea level rise due to meltwater runoff is likely higher than previously predicted. Getting this newly observed physical process into these models is an important next step for the team.
Using unmanned aerial vehicles, Colgan also plans to begin surveying the changes in ice sheet surface reflectance caused by the development of massive ice layers associated with firn cap-off. There are preliminary indications that firn cap-off is also occurring in the ice caps of the Canadian High Arctic.
(BOSTON) — Researchers from the Boston University School of Public Health and the University of Pennsylvania have found that prior studies of the link between obesity and mortality are flawed because they rely on one-time measures of body mass index (BMI) that obscure the health impacts of weight change over time.
The study, published online in the journal Proceedings of the National Academy of Sciences, maintains that most obesity research, which gauges weight at only a single point in time, has underestimated the effects of excess weight on mortality. Studies that fail to distinguish between people who never exceeded normal weight and people of normal weight who were formerly overweight or obese are misleading because they neglect the enduring effects of past obesity and fail to account for the fact that weight loss is often associated with illness, the researchers said.
When such a distinction is made, the study found, adverse health effects grow larger in weight categories above the normal range, and no protective effect of being overweight is observed.
“The risks of obesity are obscured in prior research because most of the studies only incorporate information on weight at a single point in time,” said lead author Andrew Stokes, assistant professor of global health at BUSPH. “The simple step of incorporating weight history clarifies the risks of obesity and shows that they are much higher than appreciated.”
Stokes and co-author Samuel Preston, professor of sociology at the University of Pennsylvania, tested a model that gauged obesity status through individuals’ reporting of their lifetime maximum weight, rather than just a ‘snapshot’ survey weight. They found that the death rate for people who were normal weight at the time of survey was 27 percent higher than the rate for people whose weight never exceeded that category.
They also found a higher prevalence of both diabetes and cardiovascular disease among people who had reached a higher-than-normal BMI and then lost weight, compared to people who remained in a high BMI category.
Stokes and Preston argue that using “weight histories” in studies of obesity and mortality is important for two reasons. One reason is that obesity at a particular age may predispose people to illness, regardless of subsequent weight loss. The other is that weight loss is often caused by illness.
The researchers used data from the large-scale 1988-2010 National Health and Nutrition Examination Survey, linking the data to death certificate records through 2011. The survey asked respondents to recall their maximum lifetime weight, as well as recording their weight at the time of the survey.
Of those in the normal-weight category at the time of the survey, 39 percent had transitioned into that category from higher-weight categories.
The study used statistical criteria to compare the performance of various models, including some that included data on weight histories and others that did not. The researchers found that weight at the time of the survey was a poor predictor of mortality, compared to models using data on lifetime maximum weight.
“The disparity in predictive power between these models is related to exceptionally high mortality among those who have lost weight, with the normal-weight category being particularly susceptible to distortions arising from weight loss,” the researchers said. “These distortions make overweight and obesity appear less harmful by obscuring the benefits of remaining never obese.”
The study comes amid controversy over the relationship between obesity and mortality, with some recent studies indicating that excess weight is a protective factor in health. One such study, a major meta-analysis in 2013 led by a researcher with the Centers for Disease Control and Prevention, indicated that being overweight was associated with lower mortality, and that slight obesity conferred no excess risk of death.
A number of past studies have shown that people who lose weight have higher rates of death than those who maintain their weight over time. Part of the reason for that disparity is that illness may be a cause of weight loss, through decreased appetite or increased metabolic demands. Few studies have adequately accounted for that source of bias, Stokes and Preston noted.
They urged more research using weight histories, saying such an approach had proven valuable in studies of smoking, which distinguish between former and current smokers and those who have never smoked.
A new study reconstructing conditions at the end of the last ice age suggests that as the Antarctic sea ice melted, massive amounts of carbon dioxide that had been trapped in the ocean were released into the atmosphere.
The study includes the first detailed reconstruction of the Southern Ocean density of the period and identified how it changed as the Earth warmed. It suggests a massive reorganisation of ocean temperature and salinity, but finds that this was not the driver of increased concentration of carbon dioxide in the atmosphere. The study, led by researchers from the University of Cambridge, is published in the journal Proceedings of the National Academy of Sciences.
The ocean is made up of different layers of varying densities and chemical compositions. During the last ice age, it was thought that the deepest part of the ocean was made up of very salty, dense water, which was capable of trapping a lot of CO2. Scientists believed that a decrease in the density of this deep water resulted in the release of CO2 from the deep ocean to the atmosphere.
However, the new findings suggest that although a decrease in the density of the deep ocean did occur, it happened much later than the rise in atmospheric CO2, suggesting that other mechanisms must be responsible for the release of CO2 from the oceans at the end of the last ice age.
“We set out to test the idea that a decrease in ocean density resulted in a rise in CO2 by reconstructing how it changed across time periods when the Earth was warming,” said the paper’s lead author Jenny Roberts, a PhD student in Cambridge’s Department of Earth Sciences who is also a member of the British Antarctic Survey. “However what we found was not what we were expecting to see.”
In order to determine how the oceans have changed over time and to identify what might have caused the massive release of CO2, the researchers studied the chemical composition of microscopic shelled animals that have been buried deep in ocean sediment since the end of the ice age. Like layers of snow, the shells of these tiny animals, known as foraminifera, contain clues about what the ocean was like while they were alive, allowing the researchers to reconstruct how the ocean changed as the ice age was ending.
They found that during the cold glacial periods, the deepest water was significantly denser than it is today. However, what was unexpected was the timing of the reduction in the deep ocean density, which happened some 5,000 years after the initial increase in CO2, meaning that the density decrease couldn’t be responsible for releasing CO2 to the atmosphere.
“Before this study there were these two observations, the first was that glacial deep water was really salty and dense, and the second that it also contained a lot of CO2, and the community put two and two together and said these two observations must be linked,” said Roberts. “But it was only through doing our study, and looking at the change in both density and CO2 across the deglaciation, that we found they actually weren’t linked. This surprised us all.”
Through examination of the shells, the researchers found that changes in CO2 and density are not nearly as tightly linked as previously thought, suggesting something else must be causing CO2 to be released from the ocean.
Like a bottle of wine with a cork, sea ice can prevent CO2-rich water from releasing its CO2 to the atmosphere. The Southern Ocean is a key area of exchange of CO2 between the ocean and atmosphere. The expansion of sea ice during the last ice age acted as a ‘lid’ on the Southern Ocean, preventing CO2 from escaping. The researchers suggest that the retreat of this sea ice lid at the end of the last ice age uncorked this vintage CO2, resulting in an increase in carbon dioxide in the atmosphere.
“Although conditions at the end of the last ice age were very different to today, this study highlights the importance that dynamic features such as sea ice have on regulating the climate system, and emphasises the need for improved understanding and prediction as we head into our ever warming world,” said Roberts.
The negative prospective mood on the state of the Canadian economy continues as 2015 is closed out. Canada’s energy rich Prairies, once again have hit a new 12 month low on the Bloomberg Nanos Canadian Confidence Index (BNCCI).
“After period of economic exuberance following the Canadian federal election we are now entering a period of greater pessimism in terms of the future strength of the Canadian economy ,” said Nanos Research Group Chairman Nik Nanos.
“Canadian households have endured labor-market upheavals and a loss of wealth in 2015. For working-age cohorts, the unemployment rate — which had improved to a cyclical low of 6.6% in January — rose to 7.1% in November. For older and higher-income households, expectations were dashed as the equity market fell 16% from 2014 peak levels”, said Robert Lawrie of Bloomberg Economics.
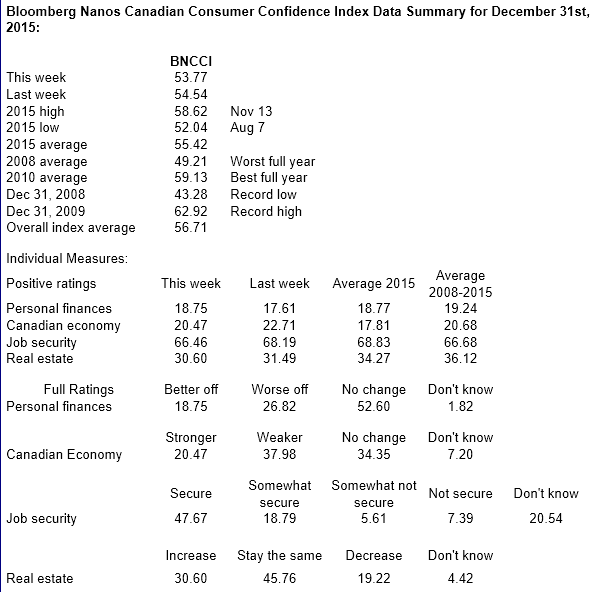
The BNCCI, a composite of a weekly measure of financial health and economic expectations, registered at 53.77 compared with last week’s 54.54. The twelve month high stands at 58.62.
The Bloomberg Nanos Pocketbook Index is based on survey responses to questions on personal finances and job security. This sub-indice was at 59.08 this week compared to 59.06 the previous week. The Bloomberg Nanos Expectations Index, based on surveys for the outlook for the economy and real estate prices, was at 48.47 this week (compared to 50.01 last week).
The average for the BNCCI since 2008 has been 56.71 with a low of 43.28 in December 2008 and a high of 62.92 in December 2009. The index has averaged 55.42 this year.
To view the weekly tracking visit our website.
Methodology
The BNCCI is produced by the Nanos Research Corporation, headquartered in Canada, which operates in Canada and the United States. The data is based on random telephone interviews with 1,000 Canadian consumers (land- and cell-lines), using a four week rolling average of 250 respondents each week, 18 years of age and over. The random sample of 1,000 respondents may be weighted by age and gender using the latest census information for Canada and the sample is geographically stratified to be representative of Canada. The interviews are compiled into a four week rolling average of 1,000 interviews where each week, the oldest group of 250 interviews is dropped and a new group of 250 interviews is added. The views of 1,000 respondents are compiled into a diffusion index from 0 to 100. A score of 50 on the diffusion index indicates that positive and negative views are a wash while scores above 50 suggest net positive views, while those below 50 suggest net negative views in terms of the economic mood of Canadians.
A random telephone survey of 1,000 consumers in Canada is accurate 3.1 percentage points, plus or minus, 19 times out of 20.
All references or use of this data must cite Bloomberg Nanos as the source.
CANUCKS FLIRTING WITH BEING WORST SCORING CANUCKS TEAM IN HISTORY
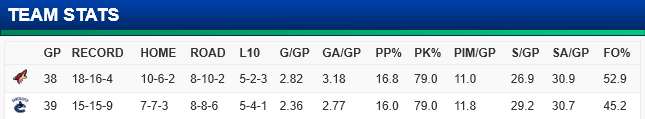
The Vancouver Canucks (15-15-9) play the final of four games against Pacific division opponents tonight as they host the Arizona Coyotes, on their 7-game home stand.
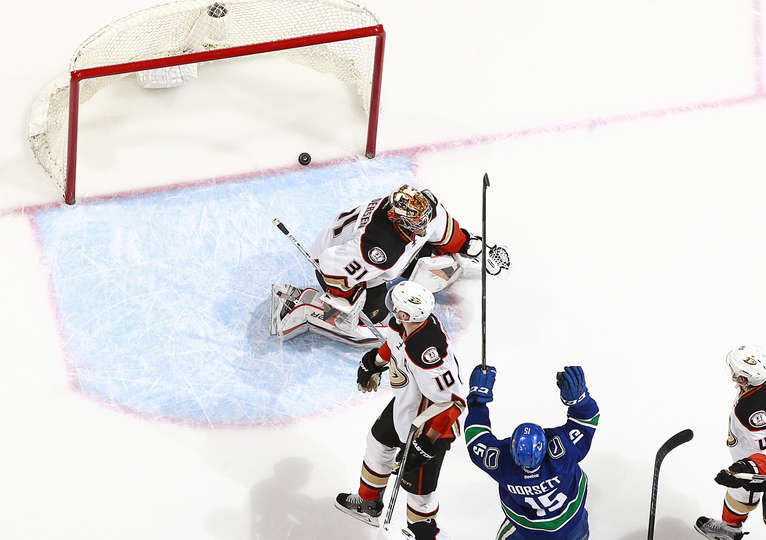
In their last game, Vancouver (15-15-9) grinded it out against the Anaheim Ducks on New Years Day, giving them a taste of their own game, in a 2-1 shootout victory at Rogers Place, in the third game of four straight against Pacific division opponents.
Chris Tanev, in his first game since December 22, scored the tying goal; and Alex Burrows got his first point in 17 games with an assist on the 1-1 goal.
VANCOUVER, BC – JANUARY 1: the puck sits in the net behind Frederik Andersen #31 of the Anaheim Ducks as Derek Dorsett #15 of the Vancouver Canucks celebrates the goal of Christopher Tanev #8 during their NHL game at Rogers Arena January 1, 2016 in Vancouver, British Columbia, Canada. Vancouver won 2-1. (Photo by Jeff Vinnick/NHLI via Getty Images)
Jacob Markstrom started his fourth straight game with Ryan Miller injured, stopping 27 of 28 shots for a .964 Sv%.
Markstrom is 3-1-0 in those four games, with a 1.93 GAA and .937 Sv%. In his last seven games, he is 3-3-1 with a 1.84 GAA and .938 Sv%.
Markstrom will start against the Coyotes, with Joe Cannata backing him up.
Canucks are averaging 2.436 goals per game. For an 82 game schedule the estimate is Vancouver will finish with 200 goals. The least number of goals ever scored by a Vancouver team in a full season of 82 games were 192 by the 1998-99 Canucks.
Vancouver played the Los Angeles Kings on December 28, losing 5-0 at Roger’s Place. Radim Vrbata notched a team-high seven shots; Andrey Pedan registered three hits and participated in his first NHL fight; and Jacob Markstrom had 33 saves in his third straight start.
Vancouver will be without goalie Ryan Miller (lower body), who is expected to skate later this week; Sven Baertschi (neck) and Brandon Sutter (sports hernia surgery), along with Dam Hamhuis (facial surgery) and Luca Sbisa (hand), according to canucks.nhl.com.
Brandon Prust will not play against Arizona due to a leg injury during the win against Anaheim . Rookie Jared McCann will replace him in tonight’s game.
The Canucks recalled right wing Alexandre Grenier from the AHL Utica Comets today. Grenier, 24, has appeared in 33 games with Utica this season, ranking second on the team in scoring with 19 points (6-13-19) along with 26 penalty minutes. He also made his NHL debut on November 18, 2015 at Winnipeg, according to the Canucks website.
At home in their last 7 games, the Canucks are 4-3-0 with 12 GF and 18 GA; averaging 23.6 shots for and 31.7 shots against.
On their home stand, the Canucks are 2-1-0 with 3 GF and 7 GA; averaging 25.3 shots for and 33.0 shots against. Their power play is 0 for 9, while their penalty kill is 6 for 8 at 75 percent.
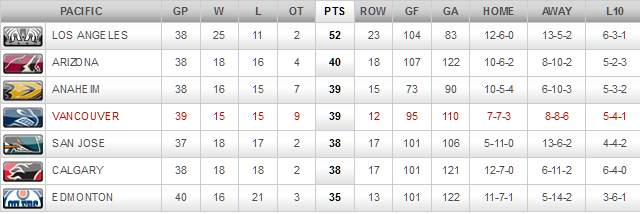
Vancouver sits in 4rth place in the Pacific division with 39 points, tied for 3rd place with Anaheim, 13 points behind the Kings in 1rst place. Canucks are a point behind Arizona, and a point a head of San Jose and Calgary; 4 points in front of Edmonton.
Arizona (18-16-4) comes into the game having played the Edmonton Oilers on Saturday at Rexall Place, losing 4-3 in a shootout in the first game of their 3 game Western Canada road swing. The Coyotes went into the game riding a 19-game point streak versus the Oilers and made it 20.
Steve Downie, Brad Richardson and Anthony Duclair scored for Arizona (18-16-4) and Domingue made 38 saves. Arizona is 16-0-4 against the Oilers in their past 20 games. The last time Edmonton beat Arizona in regulation was a 4-3 win on Jan. 25, 2011.
Arizona defeated Winnipeg 4-2 at Gila River Arena on December 31rst. Shane Doan scored 2 goals or more for the 3rd time in his last 4 home game; Mikkel Boedker and Michael Stone extended their point streaks to 4 games each; Tobias Rieder led ARI with 5 shots; Michael Stone led ARI with 5 hits and 3 blocked shots. Goalie Louis Dominuge had 35 saves in the Coyotes win.
Louis Domingue is expected to start in goal vs. Vancouver. Domingue is 3-0-2 in his past five starts and stopped 160 of 175 shots in those games.
The Coyotes have earned a point in 8 of their last 10 games (5-2-3), 32 GF and 32 GA. In those games, their power play is 9 for 42, 21.4 percent; penalty kill, 23 for 33, 69.7 percent. Face-off winning percentage is 53.4 percent.
Arizona is 1-5-1 in their last 7 road games, with 15 GF and 28 GA; power play, 2 for 20, 10 percent; penalty kill, 18 for 22, 81.8 percent. Face-off winning percentage, 48.2 percent.
The Coyotes currently own a 7-1-2 record vs. Pacific Division teams this season. Only the New York Islanders have fewer regulation losses (0) against teams inside their own division. Arizona has outscored Pacific division opponents 34-21 through 10 games and have earned a point in 7 straight games against division teams.
ARIZONA COYOTES NOTES
Mikkel Boedker has produced points (1-6-7) in 4 of his last five games and leads the Coyotes in points with 12-18-30.
Michael Stone had a career-best 4-game point streak (1-4-5) stopped against Edmonton.
Oliver Ekman-Larsson’s 10 goals rank tied for 4th in the NHL among League defensemen. The Swedish D-man now has 65 career goals, which pits him tied for 6th among defensemen in franchise history. Ekman-Larsson’s 34 goals since the beginning of last year rank as the most among all NHL defensemen.
Arizona defensemen are 2nd in the League with the most goals (26). Oliver Ekman-Larsson leads Arizona d-men with 10 goals, while Connor Murphy has tallied 4 goals. Nicklas Grossmann and Michael Stone each have 3 goals. A Coyotes’ defenseman has scored a goal in 14 of the last 20 contests.
Coyotes’ rookies currently lead NHL teams in rookie points (63) and goals scored (27). In fact, Max Domi and Anthony Duclair’s combined point total alone (48) is more than every team besides CHI (56). Duclair is tied for the 2nd most goals among 1st year skaters with 11; Domi is tied for the 3rd most goals with 10.
Captain Shane Doan surpassed Dale Hawerchuk (379) for the all-time franchise goals record by scoring a goal in the 1st period on Dec. 31, 2015 vs. WPG . The Coyotes Captain is also just 3 PPG’s behind Hawerchuk (122) and 12 points from Hawerchuk (929) for tying the franchise lead.
Arizona ranks 6th in the NHL with a 2.82 goals per game and lead the Pacific Division with 107 goals scored.
Arizona ranks 2nd in the League with a 52.9 percent face-off win percentage. The team finished last season ranked 7th in the League (51.8%).
Coyotes hold an 11-5-1 record when they allow no power play goals.
CANUCKS JOTTINGS
Canucks are averaging 2.436 goals per game. For an 82 game schedule the estimate is Vancouver will finish with 200 goals. The least number of goals ever scored by a Vancouver team in a full season of 82 games were 192 by the 1998-99 Canucks.
Back in 2010-2011, Vancouver, after 39 games played, were 38 for 156 on the power play for 24.4 percent, and 2nd in the NHL. This season, after 39 games, Vancouver is 28th in the NHL, 21 for 131 opportunities, for 16.0 percent.
Vancouver is 27th in the NHL as a team in hits with 749; 16th in giveaways with 305; 17th in blocked shots with 523; 25th in takeaways with 192.
Vancouver is 2 for 35 in their last 13 games with the man advantage (2 for 24 at home). They are 0 for 20 in their last 9 games as well.
Canucks power play is a killer at 18 for 20, 90.0 percent in their last 7 home games. And 24 for 29 in their last 7 games overall, 82.8 percent.
Vancouver has points in 8 of its last 14 (6-6-2=14 pts) & 12 of its last 21 games (8-9-4=20 pts).
Vancouver is 2-1-2=6 pts at home, against the Pacific Division this season, including 4-1-1=9 pts on the road.
Daniel and Henrik Sedin have 6 points in their last 7 home games (1-5=6 each).
Radim Vrbata has 28 shots in his last 7 home games. Daniel Sedin and Alex Edler are next with 15 each.
Bo Horvat in the last 7 home games has a FOW% of 58.6 percent (68 FOW and 48 FOL); 12 shots, 9 hits, 6 takeaways and 5 blocked shots.
Radim Vrbata, Brandon Prust and Chris Higgins have no goals against Pacific division teams.
Daniel Sedin is 3 goals from tying Markus Naslund (346) for first all-time in franchise goals
Alex Edler is 2 goals from tying Sami Salo (74) for third all-time among defencemen in franchise goals
Vancouver entered 2016 with 23 games to play before the February 29th deadline: 14 games at home and 9 games away. The Canucks entered 2015 with 27 games to play before the March 2, 2015 deadline and were 15-12-0: 8-6-0 at home and 7-6-0 on the road.
Canucks picked up Sven Baertschi from Calgary at the 2015 trade deadline for a 2015 2nd-round pick in the NHL draft.
Daniel Sedin and Jannick Hansen each have 3G and 3A in 11 games against Pacific division opponents, with Hansen having a plus/minus of +9.
Bo Horvat ranks 46th among all NHL skaters in faceoff win-percentage (more than 350 faceoffs taken) at 51.1%).
COMING INTO TONIGHT
CANUCKS AND NHL PLAYERS STATS
Daniel Sedin is tied for 10th in NHL scoring with 37 points (16-21=37).
Henrik Sedin is tied for 23rd in NHL scoring with 33 points (9-24=33).
Derek Dorsett is 52nd in NHL hits with 87.
Chris Tanev is tied for 7th in the NHL in blocked shots with 94.
Alex Edler is tied for 10th in the NHL in blocked shots with 87.
Henrik Sedin is tied for 9th in the NHL in assists with 24.
Radim Vrbata is 8th in the NHL in shots on goal with 138.
Daniel Sedin is 9th in the NHL in shots on goal with 136.
Henrik Sedin is 16th in the NHL in total face-offs with 678. FOW% of 47.8
Bo Horvat is 17th in the NHL in total face-offs with 675. FOW% of 51.1.
Brandon Prust is tied 1rst in the NHL in fighting majors with 7.
Derek Dorsett is tied for 2nd most fighting majors in the NHL with 6.
Derek Dorsett is tied for 1rst in the NHL in misconducts with 4.
Derek Dorsett is tied for 2nd in the NHL in roughing penalties with 8.
Derek Dorsett is tied for 4rth most minor penalties in the NHL with 19.
Derek Dorsett leads the NHL in penalty minutes with 108.
Jacob Markstrom has the 5th least goals allowed in the NHL, for goalies playing at least 10 games or more, with 26.
Jacob Markstrom is 21rst in the NHL in GAA with 2.44.
Jacob Markstrom is tied for 16th in the NHL in Sv% with .921
Ryan Miller is 4rth in the NHL in goals allowed with 76.
Ryan Miller is 12th in the NHL in shots faced with 836.
Ryan Miller is 12th in the NHL in saves made with 760.
Ryan Miller is tied for 1rst in the NHL in overtime losses with 6.
Alex Edler is tied for16th in the NHL in TOI/G with 24:34.
Jannick Hansen is tied for 21rst in the NHL in plus/minus with a +11.
Daniel Sedin and Henrik Sedin are tied for 32nd in the NHL in plus/minus with a +10.
Bo Horvat is tied for 2nd in the NHL in negative plus/minus with a -17.
Radim Vrbata is 8th in the NHL in negative plus/minus with a -14.
LACK OF PRODUCTION
Bo Horvat, 27 games without a goal; plus/minus of -14
Chris Higgins, 20 games without a goal; plus/minus of -12
Adam Cracknell, 19 games without a goal
Alex Burrows, 17 games without a goal; plus/minus of -7
Derek Dorsett, 1 goal in last 30 games played
Brandon Prust, 1 goal in last 28 games played
Jared McCann, 1 goal in last 19 games played; plus/minus of -8
Radim Vrbata, 1 goal in last 10 games played
Chris Higgins, 1 assist in last 23 games played
Chris Tanev, 1 assist in last 23 games played
Brandon Prust, 1 assist in last 19 games played
THE CANUCKS HAVE NEVER PLAYED A FULL SEASON WITHOUT A 25 GOAL SCORER. WHO WILL IT BE THIS YEAR?
Daniel Sedin, 16 goals in 39 games played
Jannick Hansen, 12 goals in 39 games played
Radim Vrbata, 10 goals in 37 games played
Henrik Sedin, 9 goals in 37 games played
Jared McCann, 7 goals in 36 games played
SEASON SNAPSHOT
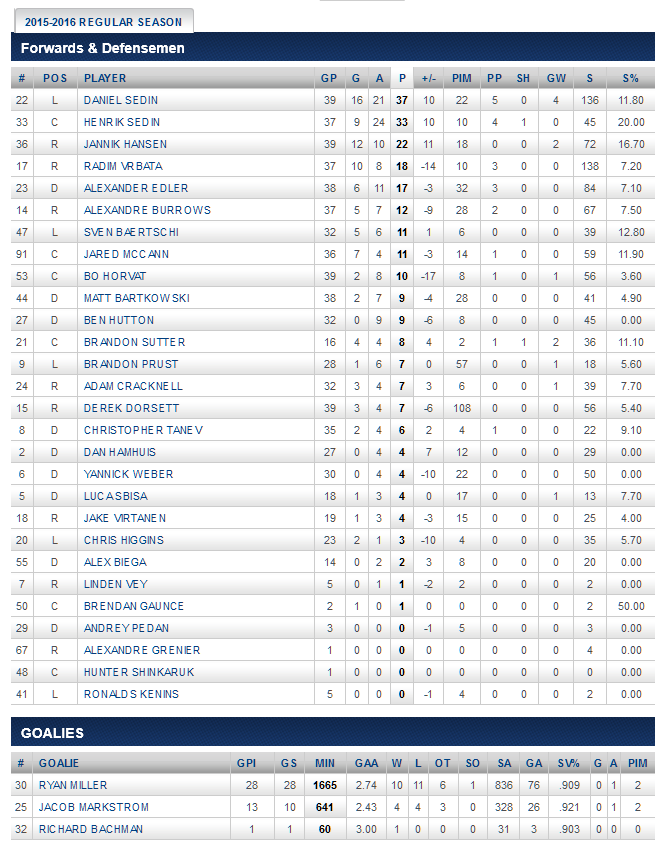
CANUCKS PLAYER STATS
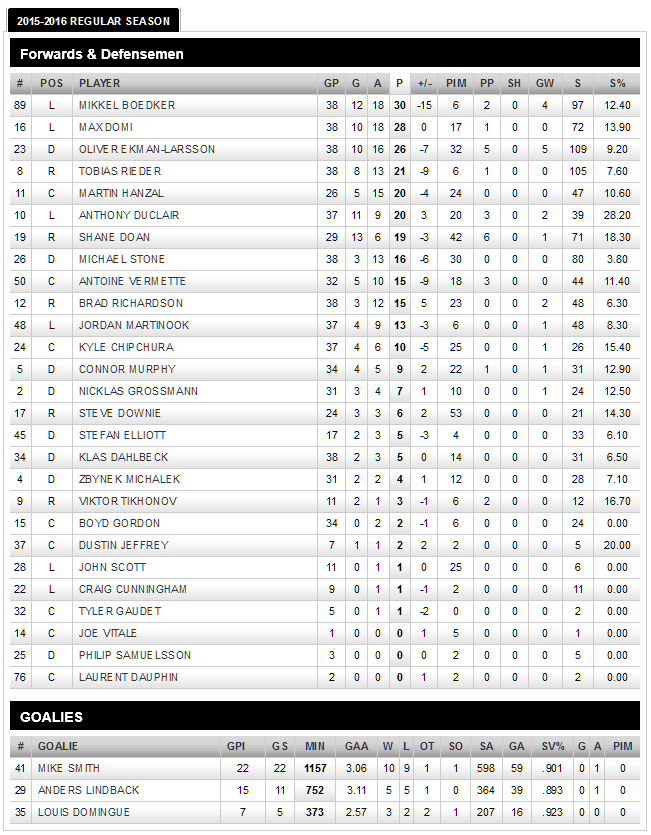
COYOTES PLAYER STATS
STATISTICS COURTESY OF THE NHL AND THE VANCOUVER CANUCKS