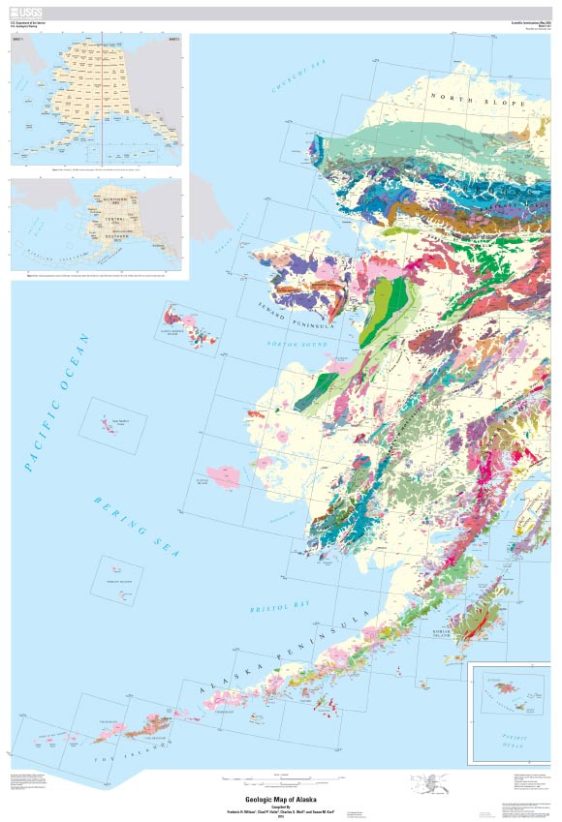
This map (Part 1 – the western part of Alaska and the Aleutian Islands, and Part 2 – the eastern part of Alaska and the list of map units) is a completely new compilation, carrying the distinction of being the first 100% digital statewide geologic map of Alaska.
More than 750 references were used in creating the map, some as old as 1908 and others as new as 2015.
“This new map and associated digital databases are the result of compilation and interpretation of published and unpublished 1:250,000-scale and limited 1:500,000- to 1:63,360-scale maps,” the USGS researchers explained.
The map gives visual context to the abundant mineral and energy resources found throughout Alaska in a beautifully detailed and accessible format.
“Covering the entire state of Alaska, it reflects more than a century of work by a host of geologists and almost two decades of compilation work,” the scientists said.
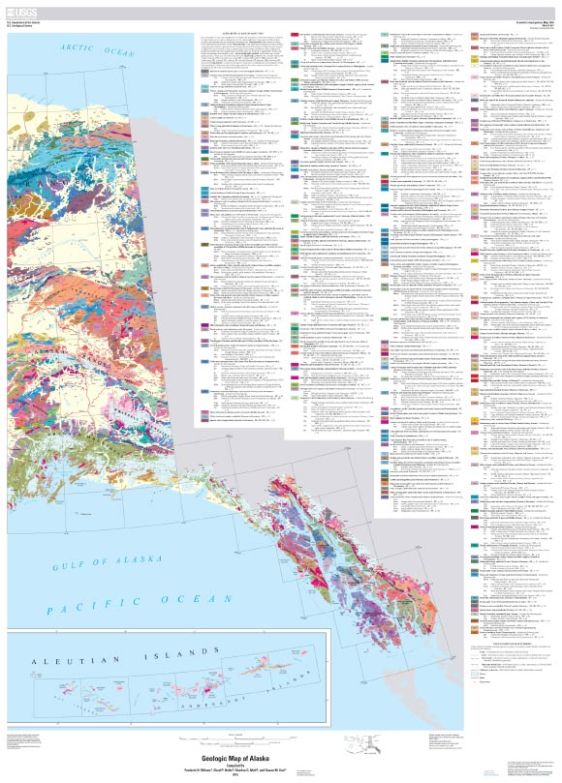
Geologic map of Alaska, part 2: generalized geologic map of the eastern part of Alaska. Image credit: U.S. Geological Survey / U.S. Department of the Interior.
“I am pleased that Alaska now has a state-wide digital map detailing surface geologic features of this vast region of the United States that is difficult to access,” said USGS Director Suzette Kimball.
“This geologic map provides important information for the mineral and energy industries for exploration and remediation strategies. It will enable resource managers and land management agencies to evaluate resources and land use, and to prepare for natural hazards, such as earthquakes.”
“The data contained in this digital map will be invaluable. It is a great resource and especially enhances the capacity for science-informed decision making for natural and cultural resources, interpretive programs, and visitor safety,” added National Park Service Director Jonathan B. Jarvis.
“A better understanding of Alaska’s geology is vital to our state’s future,” said Sen. Lisa Murkowski, R-Alaska. “This new map makes a real contribution to our state, from the scientific work it embodies to the responsible resource production it may facilitate. Projects like this one underscore the important mission of the USGS, and I’m thankful to them for completing it.”
“This map is the continuation of a long line of USGS maps of Alaska, reflecting ever increasing knowledge of the geology of the state,” said USGS research geologist Dr Frederic Wilson, who is the lead author of the new map.
_____
Wilson, F.H. et al. 2015. Geologic map of Alaska: U.S. Geological Survey Scientific Investigations Map 3340, pamphlet 196 p., 2 sheets, scale 1:1,584,000; doi: 10.3133/sim3340
Source: USGS Researchers Reveal First-Ever Digital Geologic Map of Alaska | Geology | Sci-News.com