
Category Archives: Uncategorized
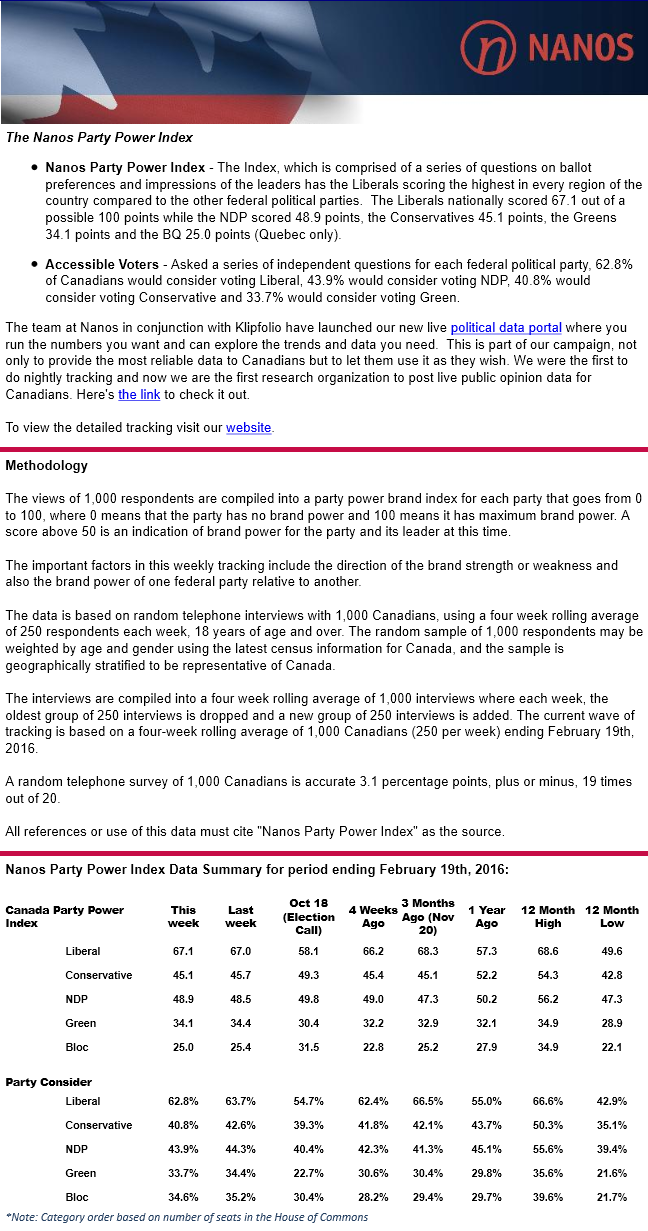
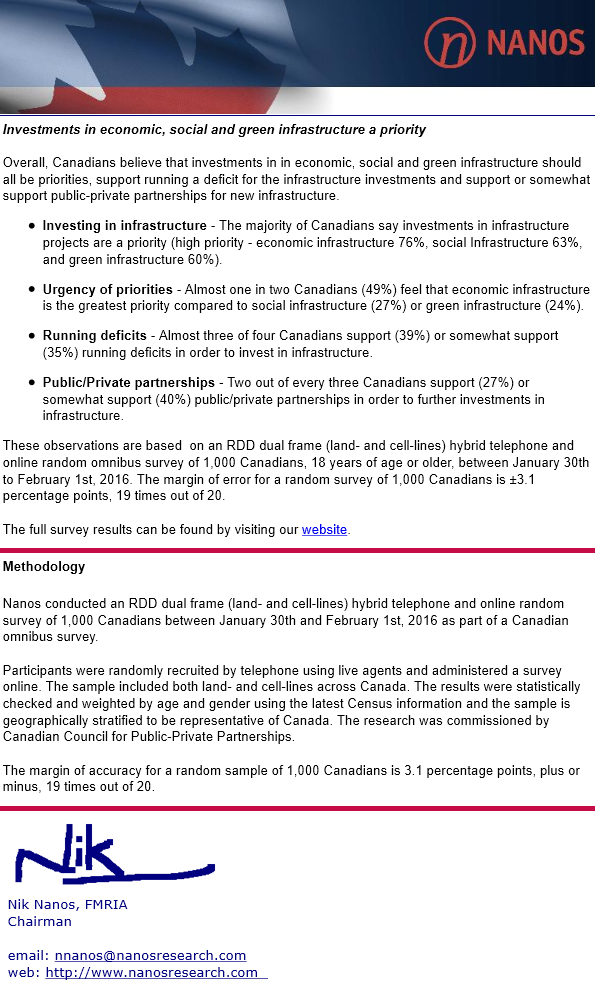
Investing in economic infrastructure seen as a high and urgent priority for Canadians (CCPPP/Nanos Survey)
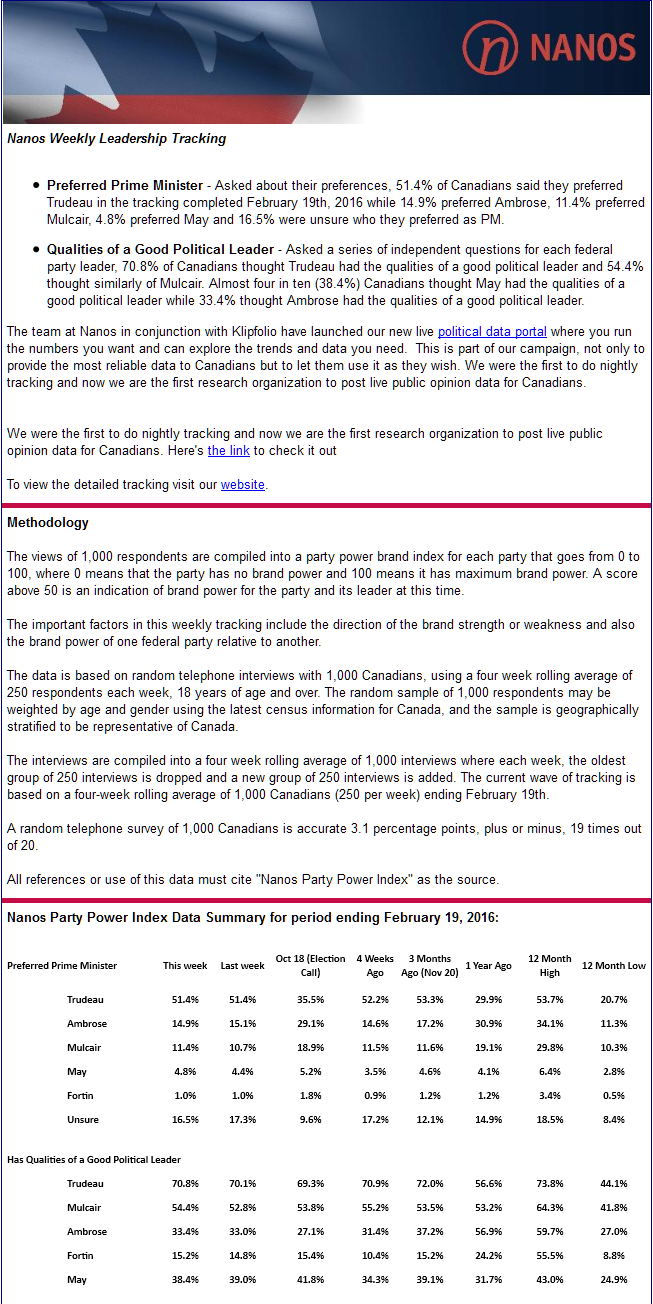
Trudeau 36 points ahead of opposition in Nanos preferred Prime Minister tracking (ending February 19, 2016)
What do Canadians in every riding believe about climate change?
MONTREAL, February 22, 2016 – As the Trudeau government prepares for its early March First Ministers Meetings on climate change, researchers from the University of Montreal, University of California Santa Barbara, Utah State University and Yale University have just released a new interactive tool to visualize, with unprecedented detail, the geographic distribution of climate opinions across Canada. It allows users to download the underlying estimates of public opinion for each province and riding in Canada. This new tool, presented in the form of maps, is available in English and in French.
The Canadian Climate Opinion Maps (CCOM) was created using a statistical model based on over 5,000 responses to national surveys from 2011-2015. It reveals that, nationally, 79% of Canadians believe that Earth is getting warmer, but the new public opinion maps show distinct differences among provinces and ridings. Moreover, about 67% of adults believe the Earth is warming in Alberta, for example, whereas 85% believe this in Quebec. Within federal electoral districts, percentages vary from 56% in the Souris-Moose Mountain riding in Saskatchewan, to 91% in the riding of Halifax, Nova Scotia.
“Our research shows that across the country, a majority of Canadians are aware of the problem of rising global temperature on Earth, and many believe humans are directly contributing to this warming. This is true across Canadian regions and across the urban-rural divide as well”, said one of the project’s lead researchers, University of Montreal Professor Erick Lachapelle.
In terms of possible solutions for fighting climate change, the idea of implementing an emissions trading system enjoys popular support (66%) across the country. Meanwhile, a carbon tax is less popular nationally (49%), with support for more carbon taxes also being much more variable across ridings.
“Given the importance of public beliefs and perceptions about climate change for mitigation and adaptation planning, we wanted to provide this tool to the public to help foster awareness and dialogue on this crucial issue,” explained University of California Santa Barbara Assistant Professor and lead author Matto Mildenberger. “Hopefully, this strong public support will be reflected in ambitious decision making in the coming months,” he said.
“Thanks to this tool, we are able for the first time in Canada to visualize the geographic diversity of opinions across this vast country, at an unprecedented level of granularity,” added Lachapelle. “We always knew opinions varied across Canadian provinces. Now we see that urban-rural differences are just as important, if not more important, features of Canadian public opinion on climate change” he said
“Of course, opinions and policy preferences are not uniform across the country. So this tool illustrates not only where climate policy support is concentrated, but perhaps more importantly, it depicts where enhanced outreach and engagement efforts are required to bring the public on side with what needs to happen” concluded Lachapelle.
Though high-resolution data sets for climate change risks are readily available, data on public opinion at the local level is almost non-existent. This new data set allows novel insight into public perceptions at scales much closer to where actual decisions, outreach and planning take place. This will be an important resource for decision-makers, planners, practitioners, academics, and engaged citizens.
About the tool:
Users can explore the maps and data by clicking on your province or riding, and compare results across questions and with other geographic areas. They should keep in mind that the uncertainty of the estimates increase as they refine their search to closer geographic scales.
All estimates are derived from a geographic and statistical model validated in the United States and applied to national survey data collected in Canada since 2011 (>5000 survey responses). These data were used to estimate differences in opinion between geographic and demographic groups based on data from Statistics Canada. The results account for change over time. The result is a high-resolution data set of estimated opinion at the national, provincial and riding scales for the year 2015. The accuracy of the estimates are approximately +/- 6 percentage points for provincial-level estimates and +/- 7 percentage points for estimates at the riding level (at a 95% level of confidence).
Source: University of Montreal
Source: What do Canadians in every riding believe about climate change? | Science Codex
Statistics Canada: Bottom 20% of households spending over half their budgets on basic necessities
FEBRUARY 12, 2016 by Press Progress

How hard is it to make ends meet these days?
New data released Friday by Statistics Canada shows low-income Canadians are spending over half their budgets on food, shelter and clothes – basic necessities.
“The 20% of households with the lowest income spent an average of $31,974 in 2014,” Statistics Canada reports. “Of this total, 51.2% was allocated to shelter, food, and clothing and accessories.”
On average, the bottom 20% of Canadian households spent $10,484 on shelter, $4,315 on food and $1,585 on clothes.
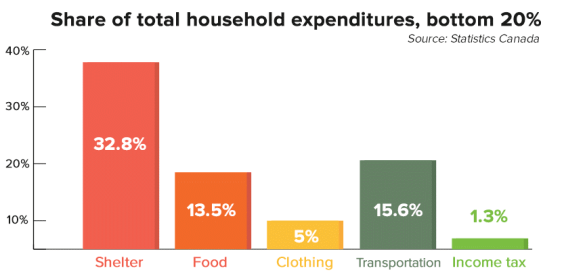
Other big expenses for households in the bottom 20% include transportation (an average expense of $4,984 in 2014), household operations ($2,259), healthcare ($1,232) and education ($1,035).
But although households in the bottom 20% spent an average of $31,974, they’re likely spending more than they’re bringing in.
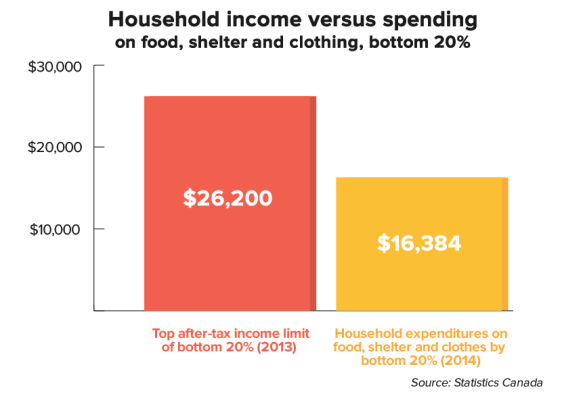
The latest available data on incomes in Canada shows the ceiling for being grouped in the bottom 20% of households was $26,200 in 2013.
Households in the bottom 20% spend on average $16,384 on food, shelter and clothing alone, representing 62.5% of the highest possible income one could earn while still being grouped in the bottom 20%.
While households in the bottom 20% spent over half their budgets on basic necessities, Statistics Canada’s data shows the top 20% of households spent “28.5% of their budgets on shelter, food, and clothing and accessories.”
Higher incomes mean bigger budgets, of course – top households spend an average of $46,167 on shelter, food and clothing each year, compared to $16,384 for the bottom 20%.
But the gap between what top (and middle) income households spend on their budgets versus what they spend on basic necessities only underlines the squeeze Canadian households at the bottom are feeling these days with the rising costs of housing and food.
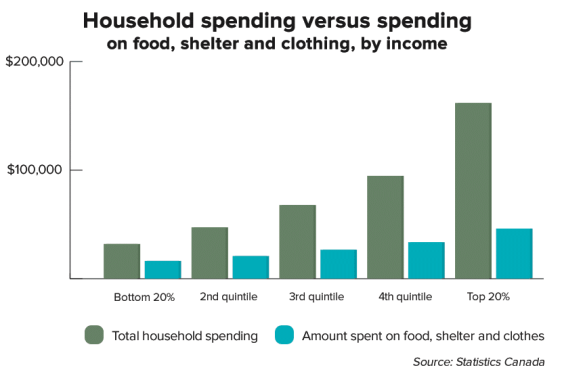
Photo: Shutterstock.
Source: Statistics Canada: Bottom 20% of households spending over half their budgets on basic necessities
