The Canadian Government’s Expenditure Plan for 2016-17

Get the report
The Government’s Expenditure Plan for 2016-17

Get the data

Main Estimates Figures. xlsx

Summary
The Government’s Expenditure Plan and Main Estimates for 2016-17 outline $250.1 billion in budgetary spending authorities. This represents a decrease of approximately $550 million compared to total budgetary authorities outlined in 2015-16, mostly driven by decreases in direct program spending (DPS), partially offset by increases in major transfers to persons, and other levels of government.

The decline, in general, stems from the sun-setting of various initiatives, for example the remediation of contaminated sites. Some of these measures are likely to be re-announced sometime in the future. Associated with this are expectations of future requests for funds through the Supplementary Estimates process, later in the year.

The Government has also initiated a pilot project, providing parliamentarians the ability to approve Transport Canada’s grants and contributions at the program level. This move allows Parliament to provide greater scrutiny on the spending of funds, and builds on recent transparency initiatives, notably the TBS InfoBase and the publication of frozen allotments in Supplementary Estimates (C) 2015-16.

Spending by policy area

Source: The Government’s Expenditure Plan for 2016-17

2015-16 Supplementary Estimates (C)

Get the report

2015-16 Supplementary Estimates (C).pdf

Get the data

2015-16 Supplementary Estimate (C) Data.xls

Summary

The third Supplementary Estimates for the 2015-16 fiscal year outline $5.1 billion of additional budgetary spending. This brings total planned budgetary spending for the year to $251 billion, 3.7 per cent higher than the previous year.

The request consists of an additional $2.8 billion of voted appropriations from Parliament and outlines an additional $2.3 billion in statutory spending.

Voted appropriations include a $435 million top up of the long-term disability insurance for members of the Canadian Armed Forces. The Government also wrote off $176 million in defaulted student loans and provided a $168 million grant to the Green Climate Fund.

Statutory spending increases stem from a $4.8 billion increase in Universal Child Care Benefit payments, which are partially offset by $2.6 billion of savings from lower interest payments on public debt.

Lastly, for the first time, these Supplementary Estimates (C) publish details regarding $5.1 billion of unspent funds, of which $1.8 billion are Treasury Board Central Votes, and $3.3 billion are frozen allotments. Frozen allotments are moneys approved by Parliament but held in escrow by the Treasury Board. Since 2004-05, frozen allotments have, on average, represented roughly two-fifths of annual “lapsed” funding. If the pattern from previous years holds, this would imply a total lapse higher than the Government projected in Budget 2015.  This would potentially result in lower than anticipated Direct Program Expenses.

Source: 2015-16 Supplementary Estimates (C)

Canadian Government Expenditures For The First Half of 2015-16

logo1

Get the report
Expenditure Monitor 2015-2016 Q2

Get the data
Expenditure Monitor 2015-16 Q2.xlsx

Summary
Total government expenditures for the first half of 2015-16 were $124.7 billion, an increase of 5.5 per cent over the same period last year ($118.2 billion). This is slightly higher than the 3.4 per cent increase in total program expenses outlined in Budget 2015. Most of this increase draws from the Government’s new enhanced Universal Child Care Benefit (UCCB). The first cheques for this enhanced benefit were delivered in July, adding $3.2 billion to the previous year’s UCCB payments.

Infrastructure spending is responsible for most of the remaining increase. Supplementary Estimates (A) 2015-16 requested over $1.1 billion for infrastructure renewal. The programs that were major recipients of these infrastructure funds have increased spending by $284 million compared to the previous year, an overall increase of 5.6 per cent. When combined with $151 million in increased spending by the Office of Infrastructure Canada’s Large Scale Infrastructure Investments program, this brings the investment in infrastructure renewal to $435 million by the end of the summer of 2015.

These spending increases are offset by lower interest rate costs on public debt. With the decline in the long-term bond yields, the Government’s average interest rate on public debt has fallen from 2.83 per cent in 2011 to 2.23 per cent in 2014. Further decreases have provided $327 million in savings from public debt interest in the first six months of 2015-16. These savings look set to continue until interest rates begin to rise.

Related reports

Supplementary Estimates (A) 2015-16

The Government Expenditure Plan and Main Estimates for 2015-16

The Fiscal and Distributional Impact of Changes to the Federal Personal Income Tax Regime

Get the report
The Fiscal and Distributional Impact of Changes to Personal Income Tax

Get the data
PIT_Estimates

Summary
The member for Rimouski-Neigette-Temiscouata-Les Basques, Mr. Guy Caron, requested that the Parliamentary Budget Officer analyze the fiscal and distributional impact of two changes to the federal personal income tax (PIT) regime announced by the government in December 2015:

1.       Introducing a 33.0 per cent PIT rate on taxable income over $200,000, effective January 1, 2016.

2.       Reducing the PIT rate on the second tax bracket (taxable income of $45,283 to $90,563 in 2016) from 22.0 per cent to 20.5 per cent, effective January 1, 2016.

The member also requested that the change to the second bracket be compared to an alternative:

  1. Reducing the PIT rate on the first income tax bracket from 15.0 per cent to 14.0 per cent (up to $45,282 of taxable income in 2016), starting on January 1, 2016.

PBO estimates the net primary impact as the increase (or decrease) in federal revenues and expenses resulting from tax rate changes applied to the existing tax base. PBO further estimates a behavioural response of taxfilers to the new lower (or higher) marginal tax rates based on assumptions for the elasticity of taxable income. The net primary impact in combination with the behavioural response is equal to the expected net fiscal impact on the government’s budget balance.

PBO estimates that the net fiscal impact of the first two changes will reduce PIT revenues by $0.4 billion in 2015-16 and about $1.7 billion annually on average from 2016-17 to 2020-21. That is, the estimated revenue gains from introducing a new tax rate of 33.0 per cent on taxable income over $200,000 fall short of covering the estimated loss in revenues from reducing the PIT rate on the second tax bracket by $8.9 billion from 2015-16 to 2020-21. Reducing the first personal income tax rate from 15.0 to 14.0 per cent would reduce revenue by $0.9 billion in 2015-16 and about $4.1 billion on average annually from 2016-17 to 2020-21.

Introducing the new tax bracket for taxable income over $200,000 at a rate of 33.0 per cent will affect taxpayers in the top decile.  The top 1.4 per cent of taxpayers will pay an additional $5,255 on average. The second bracket change will affect 43 per cent of taxpayers, and primarily the top 30 per cent of earners.  The first bracket change will affect the most number of taxpayers with tax savings distributed across the top 60 per cent of earners.

Source: The Fiscal and Distributional Impact of Changes to the Federal Personal Income Tax Regime

Household Indebtedness and Financial Vulnerability

Get the report
Household Indebtedness and Financial Vulnerability.pdf

Get the data
Figures_Data.xlsx

Summary
This report reviews the evolution of household indebtedness in Canada and assesses prospects for household financial vulnerability over the medium term. The assessment, however, is based on financial indicators that represent economy-wide averages, which can mask wide variation across households. An assessment of financial vulnerability based on household microdata is beyond the scope of this report.

The indebtedness of Canadian households continues to trend higher. In the third quarter of 2015, total household debt (i.e., credit market debt plus trade payables) reached 171 per cent of disposable income. In other words, for every $100 of disposable income, households had debt obligations of $171. This is the highest level recorded since 1990.

  • Among G7 countries, Canada has experienced the largest increase in household debt relative to income since 2000. Households in Canada have become more indebted than any other G7 country over recent history.
  • Measured relative to household assets, household debt has moderated in recent years. In the third quarter of 2015, household debt accounted for 17.0 per cent of household assets. But this was still above the average of 15.4 per cent prior to the global financial crisis.
  • Analysis conducted at the Bank of Canada suggests that low interest rates, higher house prices and financial innovation have contributed to the increase in household indebtedness.

Policymakers continue to express concern about the vulnerability of households to economic shocks, such as unexpected job loss or higher-than-expected interest rates. While the household debt-to-income ratio provides an indication of household indebtedness and facilitates international comparisons, it provides a limited measure of household financial vulnerability.

What matters more for financial vulnerability is not so much the level of the debt relative to income, but rather the capacity of households to meet their debt service obligations. A financially vulnerable household is one that is required to devote a substantial portion of its income to service its debt. It faces greater exposure to negative income and interest rate shocks, and is more likely to be delinquent in its debt payments.

Financial vulnerability is typically measured by the debt service ratio (DSR), that is, household debt payments expressed relative to disposable income. In this report, we adopt Statistics Canada’s concept and measure of obligated debt payments, which includes required principal and interest payments, but excludes debt prepayments.

Based on PBO’s November 2015 Economic and Fiscal Outlook, we project that household debt will continue to rise, reaching 174 per cent of disposable income in late 2016, before returning close to current levels by the end of 2020.

Household debt-servicing capacity will become stretched further as interest rates rise to “normal” levels over the next five years. By the end of 2020, the total household DSR, that is principal plus interest, is projected to increase from 14.1 per cent of disposable income in the third quarter of 2015 to 15.9 per cent.

Household debt service ratios

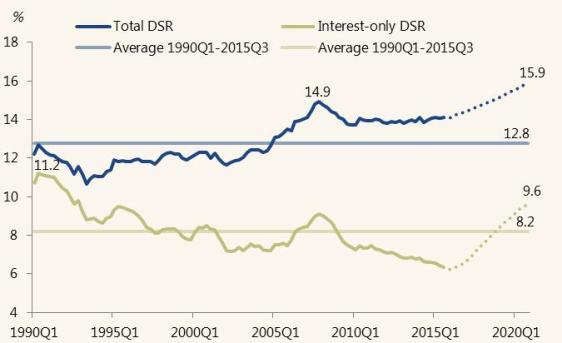
Based on PBO’s projection, the financial vulnerability of the average household would rise to levels beyond historical experience.

  • The projected increase in the total DSR to 15.9 per cent would be 3.1 percentage points above the long-term historical average of 12.8 per cent (from 1990Q1 to 2015Q3). It would also be almost one full percentage point above its highest level over the past 25 years, 14.9 per cent, which was reached in 2007Q4.

Analysis conducted at the Bank of Canada (see Djoudad (2012)) indicates that an increase in the DSR “would imply that households are more vulnerable to negative shocks to income or to interest rates, making household balance sheets more precarious and having a negative impact on financial institutions”.

Source: Household Indebtedness and Financial Vulnerability