More on Demographics, Demand, and Canada’s Falling Employment Rate

Posted by Jim Stanford May 11th, 2014   http://www.progressive-economics.ca

My post last week on the continuing decline in the employment rate in Canada (to below 61.5% in April, barely higher than the low point reached in the 2008-09 recession) has sparked some continuing discussion about the role of demographic change in explaining that decline (as opposed to a shortage of labour demand).

Is the decline in the employment rate due to weak labour market conditions, or is it due to the ageing of the workforce (as a result of which a larger share of the working age population consists of people in older age categories which normally have lower labour force participation and employment incidence)?

The answer, obviously, is “Both.”  The ageing of the Canadian workforce is a decades-old trend, it did not start in February 2008 (when the overall employment rate peaked at 63.8%).  Until then, the ageing of the workforce did not prevent the overall labour market from enjoying higher employment rates over time.  The downturn in the business cycle did start in 2008.  So it’s reasonable to conclude that this turn likely reflects cyclical (not structural) factors.

We can try to sort out the two forces at play by disaggregating the employment rate numbers by age category.  My methodology in analyzing the overall decline in the employment rate was to compare today’s rate to the pre-recession peak, and then estimate how much more employment would be required to get back to that pre-recession employment rate.  I interpreted that as a broad measure of the amount of new employment required to truly repair the damage from the recession.  That approach is certainly more reasonable than the argument made by the federal government that since absolute employment today is higher than it was before the recession, all the damage done by the recession has been repaired; this argument ignores 6 years of population growth which added over 2 million Canadians to the working age population.

Now let’s replicate my analysis, but disaggregating the employment rate data into broad age categories.  Young workers (15-24) have experienced the worst decline in employment incidence.  So-called “core” workers (25-54) have experienced a more modest decline.  Older workers (55 and over) have experienced a higher employment rate.  Whether this is good or bad depends on how many of these older workers are choosing to work longer for positive reasons, and how many have been compelled to stay in their jobs by reduced or less secure pension incomes.

Decline in Employment Rate

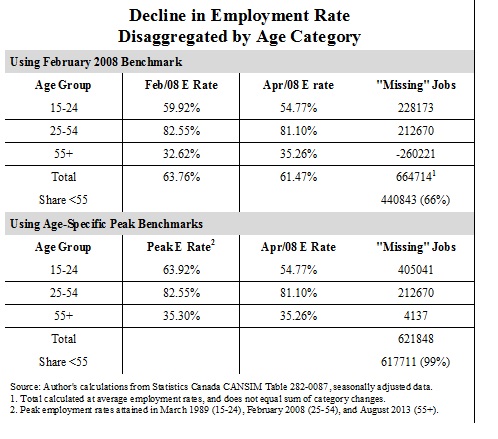
The first part of this table shows that for the two under-55 categories, a total of 441,000 additional jobs would be required to rebuild the two under-55 employment rates back to their respective February 2008 levels.  That represents two-thirds of the total 665,000 missing jobs I had estimated on the basis of the analysis of the aggregate 15+ employment rate.  (Because of the shift-share phenomena discussed above, the total “missing” jobs does not equal the sum of the age category “missing” jobs.)  In other words, two-thirds of the deterioration in the overall employment rate since 2008 can be ascribed to the deterioration of employment incidence among under-55 workers — and hence can’t be directly attributed to demographic change.  Perhaps the rest of the 665,000 jobs could be attributed to demographic ageing, offset somewhat by the rising employment incidence among the 55+ category.

Another approach, that would more closely replicate the spirit of my aggregate analysis, would be to separately locate the peak employment rate experienced within each age category, rather than using the peak employment rate for the aggregate 15+ labour force (which was February 2008).  After all, if we’re going to disaggregate current employment performance by age group, we may well wish to also disaggregate the parallel task of measuring the extent to which current employment falls below peak (or potential) employment incidence.  This exercise is summarized in the lower part of the table.

The peak employment rate for the “core” 25-54 age group was attained in February 2008, so there is no difference for that group.  The peak employment rate for young workers was attained back in 1989 (the employment rate for young workers in 2008 was still almost 4 percentage points below that peak, reflecting both higher youth unemployment in 2008 than 1989 and lower labour force participation, presumably due mostly to higher participation in post-secondary education — although PSE enrollment itself partly reflects weak employment opportunities).  The peak employment rate for the over-55 group was attained in August last year; even in this group the employment rate has declined in recent months.

Comparing the actual employment rate to the historical peak rate within each category, leads to a combined estimate of “missing” jobs of 622,000 positions — almost all of which were borne by the two under-55 age groupings (since older workers are experiencing close-to-peak employment rates).  That’s not hugely different from the 665,000 missing-job estimate I derived on the basis of the overall population.  The takeaway from this analysis: Even adjusting for the ageing of Canada’s workforce, the economy would need a total of 622,000 more jobs to bring up the employment rate (for each age category of worker) to its potential (based on peak attained employment rates).

I certainly accept that demographic change is part of the story of Canada’s falling employment rate.  That being said, however, I think the following take-away conclusions are valid:

  • The decline in the employment rate is due more to weak employment demand than to demographic change.

  • The decline in the employment rate is clearly visible in young and core workers.
  • Employment in Canada among workers under 55 is hundreds of thousands positions (from 441,000 to 618,000, depending on your choice of benchmark) below what it would be if previous peak balances between workers and jobs were re-attained today.
  • And since the pre-recession benchmark was not itself a position of full employment, the true problem of underutilization of labour in Canada is even greater.

Labour force participation among under-55 workers has also declined significantly (this is not reported in the table), and so far in 2014 has averaged its lowest levels in both age groups (15-24 and 25-54) since 2002.  Overall labour force participation (among all people 15+) is at its lowest level since 2001.  So the decline in labour force participation (like the decline in the employment rate) is mostly due to factors other than demographics (presumably, weak labour demand).

The phenomenon of rising participation and employment among older workers is an important one that needs lots more analysis.  Indeed, it is trickling over into the decline in employment rates among the youth and core age groups.  In a demand-constrained labour market, younger workers always bear a disproportionate share of the burden of un- and underemployment (reflecting last-hired first-fired effects, etc.).  Therefore, while much of the decline in employment incidence among under-55 workers reflects weak overall labour demand, some of it also reflects a redistribution of employment from younger to older workers.  This is a perverse result for many economic and social reasons, and should lead us to question policies (like postponing the retirement age to 67, and other restrictions on early retirement) which are helping push up employment rates among older workers.

The Conservative economic record: 665,000 missing jobs

May 9, 2014 by PressProgress

Employers eliminated 30,900 full-time jobs last month and 25,600 Canadians left the labour force altogether, Statistics Canada job numbers released Friday show.

With an increase of just 2,000 part-time jobs for a net loss of 28,900 jobs, Erin Weir, an economist with United Steelworkers, puts the bad news in context.

“This large decline in employment coincided with an increase of 41,000 in Canada’s working-age population. The employment rate, the proportion of working-age Canadians who are employed or self-employed, fell to 61.5% – its lowest level since March 2010,” Weir said in a statement.

In other words, if the employment rate was back at its pre-recession peak (63.8%), Canada would have 665,000 more jobs today. “Damage of recession has not been repaired,” tweeted Jim Stanford, an economist with Unifor. 

Instead, Canada’s employment rate of 61.5% is now only 0.2 points above July 2009, the trough of the recession. “Employment rate has been steadily eroding since late 2012. Cda’s recovery has no engine, no momentum – thanks, austerity,” added Stanford.

Meanwhile, Douglas Porter, chief economist with the Bank of Montreal, told the Canadian Press that “there’s no question this was a bit of a disappointment. It continues a trend we’ve seen over the last six months of down then up, and up then down. So we’re seeing a see-saw action in Canadian employment.”

Here’s what that looks like, courtesy of Unifor:

Job number - May 2014

It ain’t easy to spin dismal job numbers

Home

The Conservative government relied on a familiar refrain to try to spin its way out of Friday’s awful jobs report released by Statistics Canada.

First, the facts:
  • Over the past year, “one full-time job was added for every four part-time jobs.”
Second, the analysis from Bay Street:
  • Scotiabank note calls jobs numbers a shocker, weakest job growth by far since the recession.”
  • “Disappointment across the board,” said Mark Chandler, head of fixed income and currency strategy at RBC Capital Markets.
  • “That full-time employment growth is nearly flat in the past year while part-time job growth is up 2.5 per cent ‘indicates that businesses are not eager to expand payrolls,'” said Arlene Kish, senior principal economist at IHS Global Insight.
Third, a recap of past Conservative spin:

Whenever faced with bad economic news, the Conservatives claim that Canada leads the G-7 in jobs and economic growth since the recession. They make this misleading statement by using selective statistics.

When population growth and purchasing power are taken into account to get the complete picture, Canada falls behind G-7 countries Germany, Japan and the United States. That’s fourth place (out of 7!).

Fouth, the go-to spin:

Watch Industry Minister James Moore try to spin the bad news using the “Yah, but we’re still #1” discredited stat.

Austerity chokes the down-and-out, as Harper and Flaherty look the other way

By Nick Fillmore  August 16, 2013  http://rabble.ca

Austerity chokes the down-and-out, as Harper and Flaherty look the other way

The exceedingly aggressive austerity cuts carried out by Prime Minister Stephen Harper and Finance Minister Jim Flaherty over the past seven years have come home to roost as millions of Canadians, depressed and without hope, are succumbing to its worst consequences.

Program cuts and tax reductions for corporations and the wealthy have had a huge, disproportionate impact on the poor, working poor, underemployed, and those with health problems including mental illness.

The massive austerity program translates into less income, decreased services, and reduced health care for many of Canada’s most vulnerable people. It appears that more than 3.5-million Canadians — mainly the poor, the unemployed/underemployed and the under-privileged — are struggling.

The attacks on the vulnerable began soon after the Conservatives came to power in 2006. They launched cuts that were a broadside attack on the government’s ability to finance many of its activities, including these much-needed employment and social support programs.

Ignoring the needs of Canadians living in desperate conditions, Harper and Flaherty initiated the extremely aggressive austerity program because of their determination to reduce the deficit and cut the size of the federal government. Their decisions were based on their own neo-liberal economic beliefs, not what Canadians needed or wanted.

There are numerous examples of needless, brutal cuts. Claiming it was concerned that some people don’t have enough incentive to work, Harper-Flaherty toughened up the Employment Insurance rules. They took millions of dollars away from mostly seasonal workers, leaving them vulnerable.

Human Resources and Skills Development Canada (HRSDC), the government department that provides the most hands-on support for the poor, is being cut more than any other department. It will lose 5,700 positions — one-quarter of its workforce by 2016. The largest cut in absolute terms is to the Citizen-Centered Services Program, which helps Canadians access government services by phone and online.

Harper also cut funding to the National Aboriginal Health Organization (NAHO) and to a number of Aboriginal women’s health organizations — crucial programs on suicide prevention, women’s health, and diabetes. They also cut the Women’s Health Contribution Program, which funds six women’s health organizations across the country.

The austerity cutting is based on Harper and Flaherty’s near-fanatical determination to cut the deficit and reduce the size of government. The two unwaveringly believe in neo-liberal economics, which enriches corporations and the wealthy at the expense of the rest of us. We have two people running our country who don’t really believe in government!

Unfortunately, the problems of the less fortunate are not acknowledged in the PMO or Department of Finance. It is much more important that interest rates remain low for the benefit of corporations and the one per cent. A Google search for any Harper or Flaherty comments that express any concern or interest in the problems of the poor comes up empty.

Two moves early on by Harper and Flaherty eliminated the ability of the Conservatives to fund the kind of generous, liberal-minded government Canadians have been used to. First, a two-per-cent cut in the Goods and Service Tax income in Flaherty’s first two budgets cost the government a staggering $10-billion to $12-billion annually in revenues that had been used to help support government services.

In addition, Flaherty has cut $60-billion in corporate taxes since the Conservatives took power in 2006 – needlessly reducing the country’s corporate tax rate to the lowest among G8 countries.

The austerity program and other government cuts have had disastrous consequences for millions of Canadians. There are staggering disparities in life expectancy based on the amount of education a person receives and their amount of education. On average, people living in rich neighbourhoods live an average of 86.3 years, while those living in a poor neighborhood live only 65.5 years — a difference of 21 years.

There is more hunger across the country than ever before. In March, 2012, 882,188 people received food from a food bank in Canada — an increase of 2.4 per cent over 2011 and 31 per cent higher than in 2008, when austerity was being launched.

Children are not spared from the suffering. According to UNICEF’s most recent report, Canada is 21st out of 29 top countries for relative child poverty, and 27th for the percentage that were overweight.

Between the years 2007 and 2011, Statistics Canada reported a 20 per cent rise in people who said their mental health was deteriorating. Mental illness is already the number one cause for disability claims in the workplace. According to the Mental Health Commission of Canada, awards for mental injury at work have dramatically increased in recent years because of pressure placed on workers to produce more during the austerity period.

It’s also likely been an increase in suicides in Canada due to the distress suffered by individuals as a result of the austerity program. Two international researchers, David Stuckler and Sanjay Basu, have documented substantial increases in suicide in several European countries and the United States as a result of austerity cuts. Suicides in Canada increased from 3,512 in 2005 to 3,890 in 2009, which takes in the early part of the austerity period. However, Statistics Canada is three years behind in posting its deaths statistics, so no information is available covering a large period of austerity. But, assuming that Canada is experiencing roughly the same fallout as are Europe and the U.S., it is safe to predict a sizeable increase in suicides here.

Throughout the Conservatives’ seven years in office, independent economists argued that the austerity program was not achieving its stated goal of preparing the country for an economic recovery, but Flaherty refused to budge.

Then in April, the world was shocked when the austerity experiment, which was had destroyed the lives of millions in Europe, was totally discredited. Thomas Herndon, a young University of Massachusetts Amherst graduate student in economics, discovered that an influential paper endorsing austerity practices as a way of rebuilding beleaguered economies was incorrect because of spreadsheet coding errors and selective data.

Amazingly, Flaherty continued with the austerity experiment. “What I worry about is those that suggest that austerity should be abandoned,” he noted. “I think that’s the road to ruin quite frankly.”

So more cuts that will affect the poor the most are on the way. Harper and Flaherty will chop another $11.8 billion from government spending by 2014-15; job losses in both the public and private sectors will be 90,000 by 2014-15; and there will be 1.4 million unemployed workers in the country in 2015.

If Harper and Flaherty really wanted to balance the budget and look after people at the margins, they could work harder to collect the $29 billion the government is owned by the rich and corporations in unpaid taxes.

They also could try harder to find the $3.1-billion that was given to the anti-terrorism program but now cannot be accounted for.

The Council of Canadians says if Harper and Flaherty really wanted to both gradually reduce the deficit and look after the needs of the poor, they could continue to stimulate job growth through needed infrastructure projects (water, transit, green energy, roads, etc.), and reverse corporate tax cuts. Not by suffocating those at the very bottom of the pyramid.

Nick Fillmore is a freelance journalist who worked in many areas with the CBC over nearly 30 years. He is a former member of THIS magazine’s editorial board and was publisher of The 4th Estate, an independent weekly in Nova Scotia, during the 1970s. Fillmore was also a founder of the Canadian Association of Journalists. To see other articles, visit his blog.

On Tim Hudak’s Evangelical Political Fervour

Thursday, August 15, 2013                 From:http://politicsanditsdiscontents.blogspot.ca

Crazed clerics are not the only ones possessed of an evangelical fervour. Young Tim Hudak, leader (at least for now) of the Ontario Progressive Conservative Party, is well-known for wanting to bring back some of that old-time religion in the form of union-bashing and dismantlement, something he likes to describe eupehmistically as workplace democracy.
Happily, the agenda clumsily yet avidly embraced by Mr. Hudak and his federal brethren is transparent to many, as the following Star letter makes clear:

Re: A Conservative banner you won’t see, Aug. 10

Susan Delacourt misses the point. While home ownership is the dream of all middle-class and would-be middle-class Canadians, the changes to tougher mortgage restrictions by the Conservative government is not the problem.

The problem is that fiscal Conservatives like Prime Minister Stephen Harper and Mayor Rob Ford, not to mention the wanabee premier Tim Hudak, bash unions and are thereby responsible for the loss of middle class and fair wage jobs.

In the name of fiscal responsibility we have seen in the last decade the radical decline of good paying employment. Unions protect not only their members but, by raising the bar on wages and benefits, also protect non-members. But, these fiscal elites bash unions and give jobs to the minimum-wage-paying private for profit sector.

The real culprit in the decline of the middle class and the smashing of their dreams is not changes to mortgage lending, but rather the overall decline of wages and salaries. The growth in wealth of the 1 per cent does not make for a sound economy. Unions are the major defence against the one-sided economy we now have.

If the middle class hopes to regain some of its vitality (and surely the entire country depends on this) then it’s time for union bashing to end. Conservatives like the prime minister and the mayor and Mr. Hudak believe that divide and conquer, by creating jealousy on the part of non-union workers of those lucky enough to be protected by group action, is the way to keep wealth in the hands of the few. That’s the secret agenda.

It’s really time the electorate woke up to this Machiavellian plan and took back their power.

Stephen L. Bloom, Toronto